Simply put, knowing how to work with Net Present Value (NPV) makes the difference between good and bad project managers. In this guide, we will explain you everything you need to know about NPV as a PM, what it is and how to correctly calculate it, as well as why it is important. Working as a PM myself, I was motivated to write this extensive guide on NPV because what they teach you in the PMBOK is simply not enough. This will set it right, explaining what is NPV in project management.
For this guide, we do not rely only on the content from the PMBOK, which is partially satisfying. Instead, we draw from the Corporate Finance literature to give you actionable skills. Calculating NPV is an important steps, and making mistakes can have huge consequences. With the tools we provide you with here, we will reduce this possibility greatly.
NPV in Project Management
The Intuition behind NPV
The intuition behind NPV is relatively simple. First, we need to understand that an organization will have, at any given time, several projects it may decide to pursue. Of course, the firm does not have unlimited money, time, personnel, so they cannot undertake all the projects. Rather, they need to choose which project, or projects, to undertake. NPV is a tool to guide the decision on which project to undertake. I would go even further; it is not just a tool: it is the tool. In other words, NPV is the only tool you should use to determine which project to pursue.
NPV works by converting each complex project into a simple number: the net present value, or NPV. NPV in Project Management, as well as in Corporate Finance, is the true value of the project for the company. Considering all costs and benefits, what is the result of this project for the company? If the NPV is $1000, then the project will increase company value by $1000. If the NPV is negative $1000, then the project will decrease company value, and it should not be pursued no matter what.
Since we translate each project into a simple number, we can easily compare projects that are quite different and rank them by NPV.
Okay, but how do we calculate the NPV of a project? To do so, we need to consider its cash flows.
Cash Flows for NPV in Project Management
To calculate the NPV in project management, we need to project the cash flows of a project. Simply put, a cash flow is a point in time when cash is flowing. That is, a point in time when you are spending or gaining a specific amount of money. So, each cash flow has two key components: the amount of cash, and the date when you receive it or spend it.
Just to set the convention right, a positive cash flow means money you are earning. Instead, a negative cash flow means money you are spending (a cash outflow). Considering this, we can plot cash flows over a timeline. Typically, we project on a timeline where the unit is year, quarter, or month – that depends on the granularity of cash flows you want for the project.

What if my project provides some non-cash benefits to my company? Some projects may be related to improving the brand or increasing productivity, and as such cash flows of the benefits are not immediately evident. However, even if there is no actual cash gained, we can give a monetary value to our benefits. Of course, these are estimates, but they are better than nothing.
To better our estimates, even if we are speaking about “real” cash benefits, we can use a weighted average. For example, you may launch a new product that has a 50% chance of generating $1500 dollar, and a 50% change of generating $500. Then, you can use the weighted average of $1000 (50% of $1500 + 50% of $500) as a cash flow.
If you want to evaluate NPV in project management, your first step is to project the timeline of all the cash flows for all your projects. Even those timelines are hard to compare, so how do we go about it? We need to extract the NPV.
Time Value of Money
To extract the NPV from cash flows, we need to consider the time value of money. Simply put, the value of money changes with time, and it decreases. Having $1000 today is not the same as having $1000 in one year. Specifically, having $1000 today is worth more than having $1000 in the future.
Why money today is worth more? In short: because you could invest it. Imagine you have $100, and your bank is giving 2% interest a year. Then, in one year you would end up with $102 ($100 + 2% of $100). If you keep it in the bank for a second year, you will end up with $104.04 ($102 + 2% of $102). So, if you want to have $100 in one year you only need to invest $98.04 today. $100 in one year are worth $98.04 today in this case.
We can quickly define an equation that compares the present value (PV) of money, that is the value in today’s money, with the future value (FV) of money, that is the value in the money of the future. In those equations, N represent the number of periods. If we gain interest over a year, then N is the number of years. The discount rate is the interest rate we are getting in the bank, it tells how much we need to discount (reduce) the value of future money.
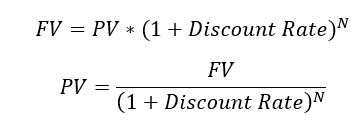
The value we want to use is the present value. If we convert all the cash flows to present value, we can quickly compare them. Specifically, we can subtract all the negative cash flows from the positive cash flows and obtain the NPV. So, NPV is equal to the following equation (consider PV as the function to compute PV, as shown above.

The present value of each cash flow depends highly on the discount rate. This is where we should focus next, because getting the discount rate wrong can make a bad project look attractive, with disastrous consequences.
The Discount Rate to Compute NPV in Project Management
When calculating the NPV for your project, you have two main assumptions to make. On one side, you need to accurately forecast the cash flows both in terms of monetary amount and timing. On the other hand, you need to use the proper discount rate. While estimating the correct cash flows requires deep understanding of your business, and as such vary from company to company, there is really one way to go when you have to define the discount rate.
This is where the PMBOK stops, but where we go above and beyond. PMBOK assumes someone high in the corporate office will give you the discount rate to use. This may be true, but most often is not the case. If you have to work with NPV in project management, you need to know the truth behind NPV. Now is the time to unveil it.
Risk Sets the Discount Rate for NPV
In short, the discount rate depends on the risk of the project. More specifically, it depends on the risk of the cash flow – you may use a different discount rate for each cash flow in some cases. However, here we mean risk in financial terms, not just “risk”.
Risk can be diversifiable or systematic. To understand this, we need to take a step back and think about this from the perspective of an investor. Think you are an insurance company, and you sell insurance against property theft. Theft to a property is unrelated to theft to another property: the fact that a property is robbed does not mean another property will be robbed as well. Hence, the more houses you are able to ensure, the more you reduce the risk of having all of your customers knocking at the door to claim their insurance money in any given year. This risk is diversifiable.
Now imagine you are the same insurance company, and you are selling earthquake insurance in the Bay Area. Now things are different, because claims are highly related. That is, if a house is damaged by an earthquake, chances are neighboring houses will be as well. In this context, adding one more house in the area does not reduce your risk. This risk is systematic. Of course, in this specific case you could edge by selling other types of insurance or to different geographical areas as well. That is beyond the point now.
Only systematic risk sets the discount rate. Yes, diversifiable risk is worth nothing, because investors can eliminate it completely by diversifying – buy stocks of a different company, pursue other projects in parallel and so on. Because of this, the actual risk of many diversifiable investments combined is zero
Measuring Risk With Volatility
Financially, we measure risk as volatility. This is how much returns of a stock deviate from their average, and we also call it standard deviation. Of course, the higher the volatility the riskier the returns of the stock. That is, the less reliable you will receive the same returns every year. Normally, higher returns are always associated with higher volatility.
We can apply the same concept of volatility to projects, not just stocks. Some projects may have binary outcome: they either succeed or fail altogether. However, most have a spectrum between success and failure. For example, launching a marketing campaign for a new product may fail to generate the desired number of customers, but generate more than zero. So, projects tend to have a varying degree of success. Because of this, we can consider them volatile. How certain are you that the outcome of the project will be as planned?
We measure volatility in the same terms as the set of results we are analyzing. If we are calculating the volatility of a stock’s returns, expressed in percentage terms, also volatility will be in percentage terms. If we are calculating the volatility of a stock’s return expressed in dollars, then also volatility will be in dollars.
The same is true for projects. We can either measure volatility as Return-on-Investment in percentage term, or in absolute terms.
We do not need to know how to compute volatility to calculate NPV in project management. This is because volatility relies on historical data, and since a project is new by nature, we do not have any. We need to use a different tool: beta.
The Efficient Portfolio
In a project like in a stock, there will be some volatility. Some of this volatility comes from project-specific or company-specific risk, that is diversifiable, while other comes from systematic risk. Systematic risk cannot be diversified, because an investor in your project can buy also stakes in other projects, but they will always carry this same type of risk.
Hence, we need a way to identify how much of the volatility of our project comes from systematic risk. The problem is, we do not have historical data because our project is new.
Nobel prizes Modigliani and Miller (MM) come to the rescue. For reasons beyond the scope of this article, they state that in the economy there is just one efficient portfolio. This is the best combination of stocks that you can possibly get to maximize your returns. Since return and volatility are related, the efficient portfolio is the one that offers you the highest return for the volatility you are willing to accept. Or, to see it in another way, it is the portfolio that offers you the lowest volatility for the level of returns that you want.

To explain this picture, consider you want to create a portfolio – a collection of stocks. At this point we can only combine stocks together, and not the risk-free asset such as Treasury bonds. By combining only stocks, we obtain a set of portfolios that provide the best possible return for any given level of volatility: those portfolio are the efficiency frontier. The point on the efficiency frontier that has no asset to its top-left is the tangent portfolio, or efficient portfolio – the best possible portfolio of all. We can combine some of it with some risk-free assets to create our desired level of return-volatility, creating the Capital Allocation Line (CAL).
Then, MM go on saying that the efficient portfolio is the market portfolio, the total combination of all stocks and financial assets that exist in the world – with their relative weight. That is, if Apple constitutes 0.02% of the world’s economy, 0.02% of the market portfolio will be made of Apple’s stocks.
Of course, this market portfolio will have a level of risk and volatility. What if you want lower volatility, or higher volatility and returns? You still invest in the same portfolio, but you combine it with risk-free assets such as Treasury bonds. Say, for example, you are willing to accept only half the volatility of the market portfolio. Instead of creating your own portfolio, that will be suboptimal, you put 50% of your money in the market portfolio, and the other 50% in risk-free assets. This combination will give you the highest possible return for the level of volatility that you want.
The same is true also in the other direction: you can borrow money at the risk-free rate and invest it in the market portfolio to have higher return and volatility.
Market Proxy
Of course, creating a portfolio with all the securities in the world is virtually impossible. Some securities are not easily traded, or they are not even available for buying and selling. Other assets may be extremely illiquid, or difficult to estimate in value.
Instead, investors decided to use a market proxy portfolio, a portfolio that is not exactly the market, but that has returns that mimics the market well. Normally, the market proxy portfolio that is used is the S&P500 index, which historically has a correlation greater than 99% to the portfolio of all tradable US stocks. Since it is very liquid and data about it are readily available, we can consider it as our market portfolio.
Beta as a Measure of Risk
If the efficient portfolio is the most efficient portfolio to hold, nobody will want to invest in your stock or buy stakes in your project. To make your proposal attractive, you need to offer returns comparable to the efficient portfolio.
If you have the same exact volatility of the market portfolio, you need to offer the same returns of the market portfolio. If you have twice the volatility, you need to offer twice the returns. Instead, if you have half the volatility, you need to offer half the returns.
As you can see, how much returns you have to provide to your investors depends on how related your endeavor (stock or project) is to the market portfolio. We call this relation beta. Beta can potentially have any value, but two are very important: a beta of 1 means that you behave exactly like the market portfolio, while a beta of 0 means there is no relation between your returns and the portfolio’s.
We can expand to say that a beta of -1 indicates that your returns are the opposite: when the return performs +10%, you perform -10%, while a beta of 2 is twice the market: when the market is +10%, you are at 20%.
For stocks, the project to compute beta comes from calculating the correlation between stock’s return and market’s returns. You can see we still need some historical data, which we do not have for our project, but we will get there in a second. Now, we can focus on how to compute the expected returns for our project. Those are the returns investors will expect from our project, if we do not provide them, they will just buy the market portfolio instead.
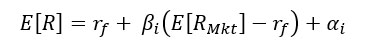
So, to calculate the expected returns, we need to add the risk-free rate to the market premium (expected return of the market portfolio less risk-free rate) multiplied by the beta of our project. Finally, we add alpha which is a measure of historical performance for our project and in this case, we can assume it to be zero and ignore it.
To get the risk-free rate, you can search for the rate on US treasury bonds, that are considered risk-free. For the expected market return, you can check the S&P500 returns. Always use the same period! If you consider the S&P500 yearly returns over 10 years, use the US treasury bond with a 10-year maturity (expiration date).
Identifying the Beta
Since you do not have historical data for your project, you need to take it somewhere else. This is the only way you will be able to calculate NPV in project management.
You can find the beta about individual companies that trade stocks in some stock exchange. However, data about one individual company tends to be extremely biased, to the point that it is unreliable. Instead, it is much more recommended to use the beta of an entire industry, comprising several firms.
Even better, you should search for asset beta. Beta, or equity beta, indicates how much a stock’s returns are related to the market portfolio. However, different companies in the same industry will have different level of debt, so also different beta (because debt increases risk). Instead, asset beta is the relationships between the company’s underlying assets and the market – imagine you were to finance the entire company with cash and no debt, what would be the beta? Asset beta. So, you need to find the industry’s asset beta.
When you identify the discount rate to use to compute NPV in project management, you must use the discount rate of a comparable investment. That is, an investment with a similar level of risk. So, you need to find a beta of an industry that is highly comparable to your project, so that you can “borrow” their beta in your calculations.
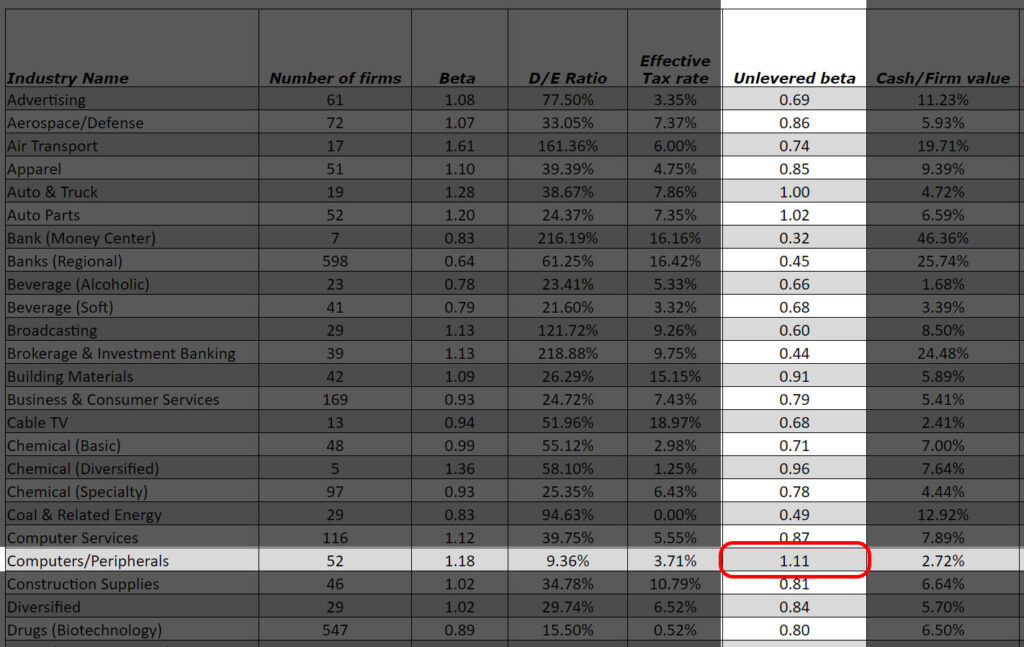
New York University can be a lifesaver here. They have a very convenient table you can check on their website for most industries. What we call asset beta, they call unlevered beta, but is the same thing (unlevered means with no leverage, with no debt). Otherwise, you can always ask Google.
Calculating Discount Rate: An Example
Now we know everything we need to compute the discount rate. In fact, we know everything we need to compute NPV in project management as well. Suppose you want to start a computer manufacturing company that produces laptops. You can either think you are starting a new company, or that you are creating a new division in an existing company that is expanding their breadth of operation.
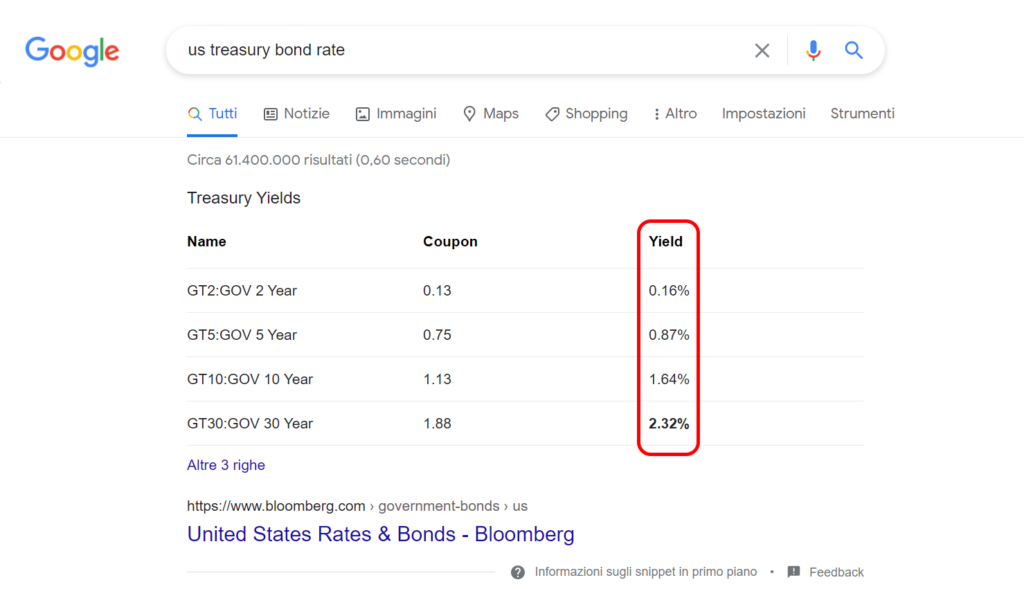
First, we need to find the risk-free rate. This takes literally just one Google search, and you do not even need to open any website. You see it there on Google. We need to use the yield, that is the return if we will hold the bond until it expires. If we assume our project will last two years, then we need to consider the 2-year bond, the first in the list. This bond has a risk-free rate of 0.16% per year, which means if we buy it, we will obtain 0.16% for the first year, and 0.16% also on the second.
Now we can move to identify the return of the market, from the S&P500. Here you can also look for annualized returns (not total returns over 2 years, average yearly returns for the last two years). However, stocks are way more volatile than treasury bonds, so you may be caught in a swing of the moment. It is generally safer to identify the S&P500 returns over a longer period, and we can generally assume it has about 9.80% yearly return – Warren Buffet has been quoted to have said “let’s make it 10% to keep things simple”. Today, we will listen to Warren and use 10%.
We can now move to identify the beta for our computer operation. NYU gives us information about Computer & Peripheral, that has an unlevered beta of 1.11.
With this in mind, we can finally calculate the discount rate to use for NPV: 0.16% + 1.11(10% – 0.16&) = 0.16% + 1.11*9,84% = 0.16% + 10.92% = 11.08%. This is the discount rate we need to use.
Advanced Valuations
Money Forever: Termination Value
While projects have an end at some point, their impact on the company may last for an indefinite time. For example, an efficiency improvement in the manufacturing process of a plant can result in a saving virtually forever, as long as the plant remains active. However, we cannot create an infinite timeline, so we need another way to evaluate cashflows with permanent effects.
A cash flow that lasts for ever is a perpetuity. Calculating the present value of a perpetuity is extremely simple: we just divide it by the discount rate (not 1 + discount rate). The intuition behind this is simple: how much money do you need to have invest to create that permanent cash flow? Imagine you want a perpetuity of $5 and the correct discount rate is 5%. You need to have $100 in the bank now. At the end of the year, you will have $105 in the bank, you will take your $5 out and you are left with $100 once again. In this way, also in the second year you can do the same thing, over and over forever. Indeed, 5/0.05 = 100.
This means we can also account for growth: we may want our perpetuity to grow over time. Take the previous example, we want $5 every year but we want it to grow at 2% per year. If we start with $100, taking out $5 leaves us back at square one. Instead, we want to invest an amount that is sufficient so that, after taking out $5, there is some money left to grow at 2%. To calculate this, we need to divide the desired perpetuity by the discount rate minus the growth rate. In this case, 5/(0.05 – 0.02) = 5/0.03 = $166.67. Since our perpetuity is growing now, it is worth more than the previous example.
It is common to create timelines to forecast cash flows at 3, 5 or 7 years. In the last year, we also add a termination value: we assume the project will continue to generate some cash flows in perpetuity, maybe at some growth rate. Obviously, this does not have to apply to all projects, use it when you think it is appropriate.
Sensitivity Analysis
With this guide about NPV in project management, we went above and beyond what is required for the PMBOK. Yet, even here with these powerful tools we are just making assumptions. A great way to stress-test our assumptions is sensitivity analysis.
With sensitivity analysis, you see how sensitive your estimates (and hence your project) are to any given variable. Is it more important to meet the target revenue? Or is it more important to keep the cost-per-unit at the desired level? What is the impact if we have 30% customers less than expected? With sensitivity analysis, you find out what the estimates are more sensitive to, so that you can also focus on them when you execute the project.
Sensitivity analysis deserves a whole different guide, but just know that you should use the What-if function in Excel to test different scenarios.
NPV in Project Management Example: Amazon Prime Passenger
Note: I wrote this article in april 2021. As of November 2022, I am employed by Amazon Web services. What you see here are random numbers to make an example. If I renamed this “FedEx passenger service”, the example would work as well. Opinions are my own and do not reflect Amazon’s.
Let’s put everything that we learned into practice with a case study, an example of calculating NPV in project management. We will do it from scratch.

Background
We all know Amazon, a huge company that branches out into many different fields. Amazon has a fleet of planes that uses to ship its parcels around the US and the world – Amazon prime air. Yet, at the moment of writing, they are only using these aircrafts for shipping and logistics – not for commercial airline services carrying passengers.
Imagine you are a manager at Amazon, and you are evaluating if you could expand into airline passenger services. You need to estimate the NPV of this project.
Drafting the Cash Flows
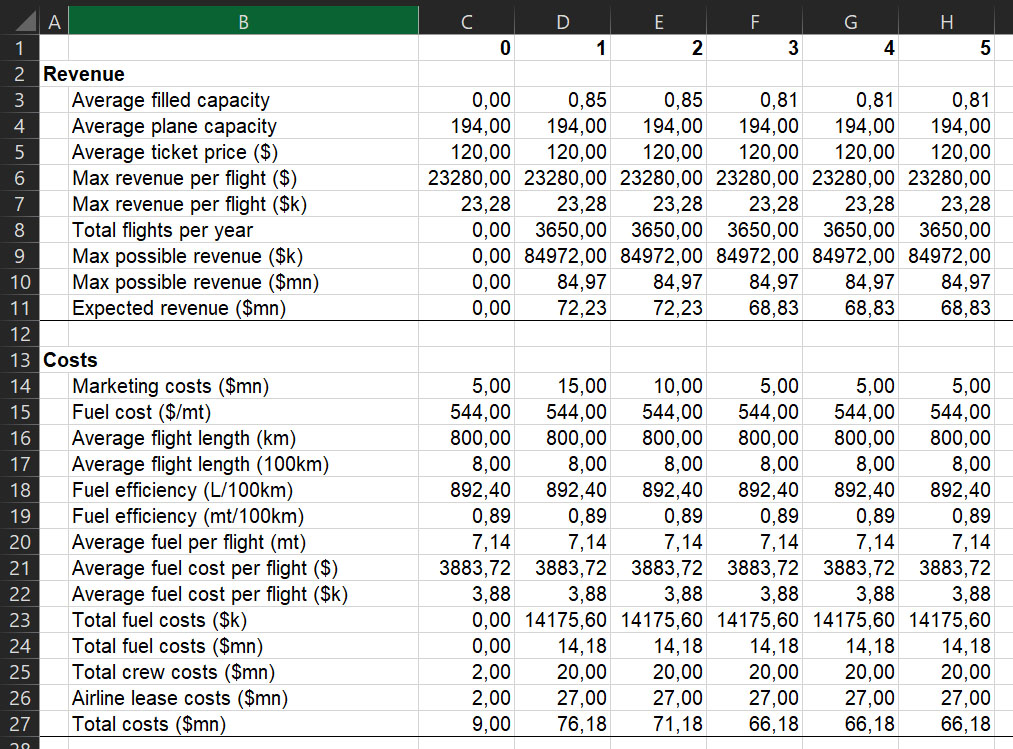
The first step, as we know, is drafting the cash flows over a timeline. Here you need to put all your knowledge about the project in place. Instead of just coming up with the numbers, you should play out with Excel to create a project dashboard that shows the underlying variables that lead to the cash flows.
For example, instead of just making up the cash flows you will get from tickets, you can estimate the average capacity you expect to fill on the plane (how many people will board) and multiply it by the average total revenue per flight. Instead of just inputting the costs of fuel costs, you can estimate how much fuel you need and how much fuel costs per barrel. You get the idea.
For this example, we will forecast up to 5 years. You can look at the following example. We started to make some guesses for current year (0) up to 6 years in the future (at the end of the 5th year from now). How we exactly obtained these guesses is beyond the point of this article, but in short we imagined how many seats we could fill (more when marketing is strong), that we would lease all the airplanes, and just made up crew costs and marketing costs. Of course, you’d want to do something more precise for your real project.
This is our timeline in Excel.
Oh, and if that was not clear – as I am writing this in 2021 – I decided to assume COVID was not a thing.
Calculating the Real Cash Flow
In the previous step, we just listed our assumptions. To keep things simple, we just made one assumption per variable. In reality, you want to do more than one. For example, we assumed that fuel will cost $524 per metric ton over the next five year. A better approach would be to say: we have an 80% possibility that it will cost $520, a 5% possibility it will cost $500, and a 15% possibility it will cost $800. For simplicity, we just projected the final result of our assumptions, rather than all the weights behind them.
In any case, now we are left to calculate the cash flows. First, we need to calculate the gross profit, revenues minus cost, then subtract the tax. Note that when we have negative cash flows, during early years, we get negative tax – that is, we have a tax credit. Effectively, tax is reducing our losses during these years.
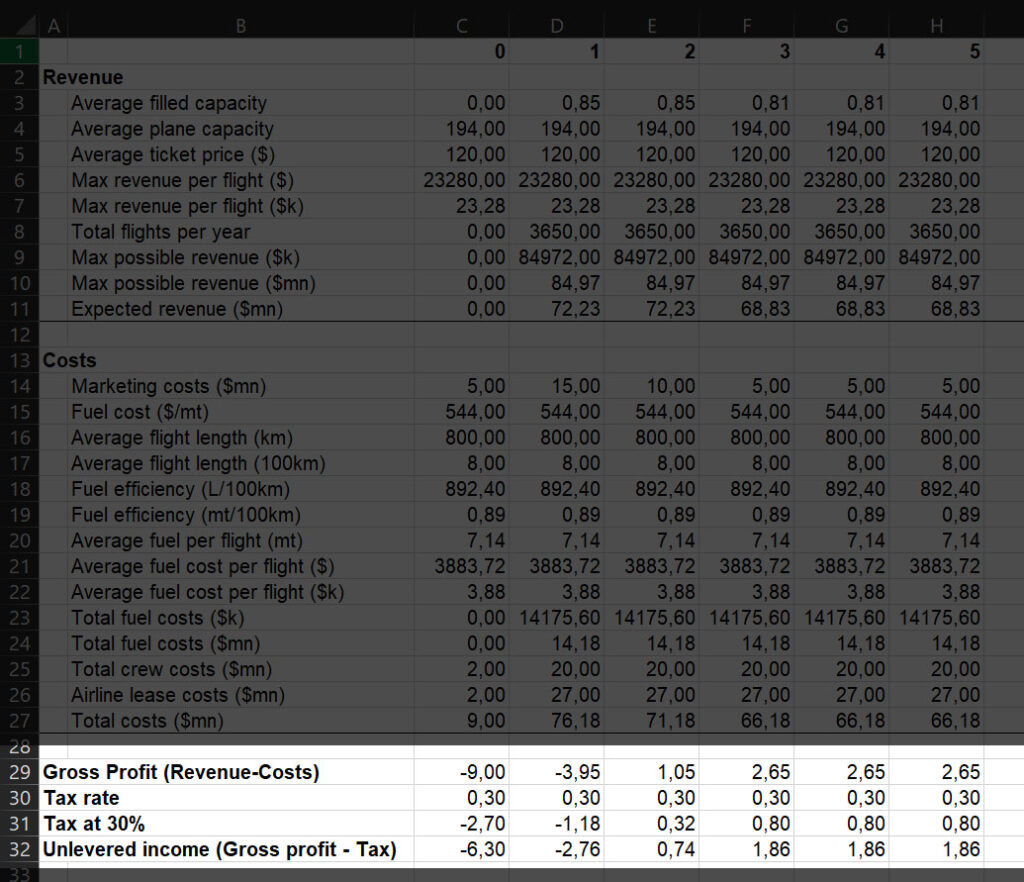
We are getting closer and closer to the calculation of NPV in project management.
Calculating Present Value and Termination Value
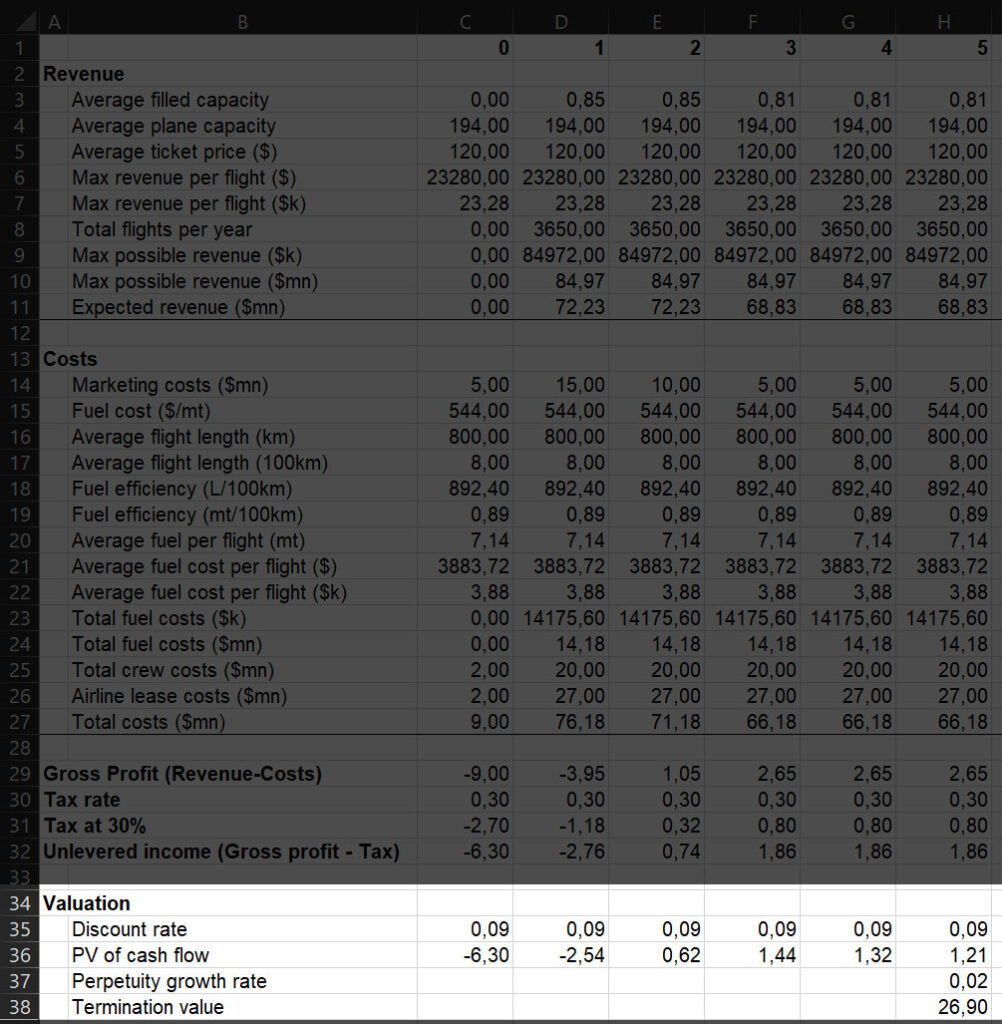
We can move on to calculate the present value of our cash flows. To do so, we need to identify the discount rate first. Here, we are assuming all cash flows have all the same discount rate. In reality, this is often not the case – for example, you may need to borrow money to finance your project, and that cash flows need to be discounted by the interest rate set by the bank.
In any case, we can proceed to identify the beta for Air Transport, which is 0.77 according to NYU. If we consider a market return of 10% and a risk-free rate of 0.16%, we know that our discount rate will be E[R] = 0.16% + 0.77(10% – 0.16%) = 8.89%.
We can now proceed to discount our cash flows. Also, we are going to assume that growth will be constant at 2% starting at year 5, and we can use this growth to calculate the termination value as well.
Calculating NPV in Project Management
Finally, we reached our goal: calculating NPV in project management. This is the simple part because we completed all the leg work. We just need to sum together the present value (PV) of all the cash flows with the termination value. Like magic, we see our NPV.
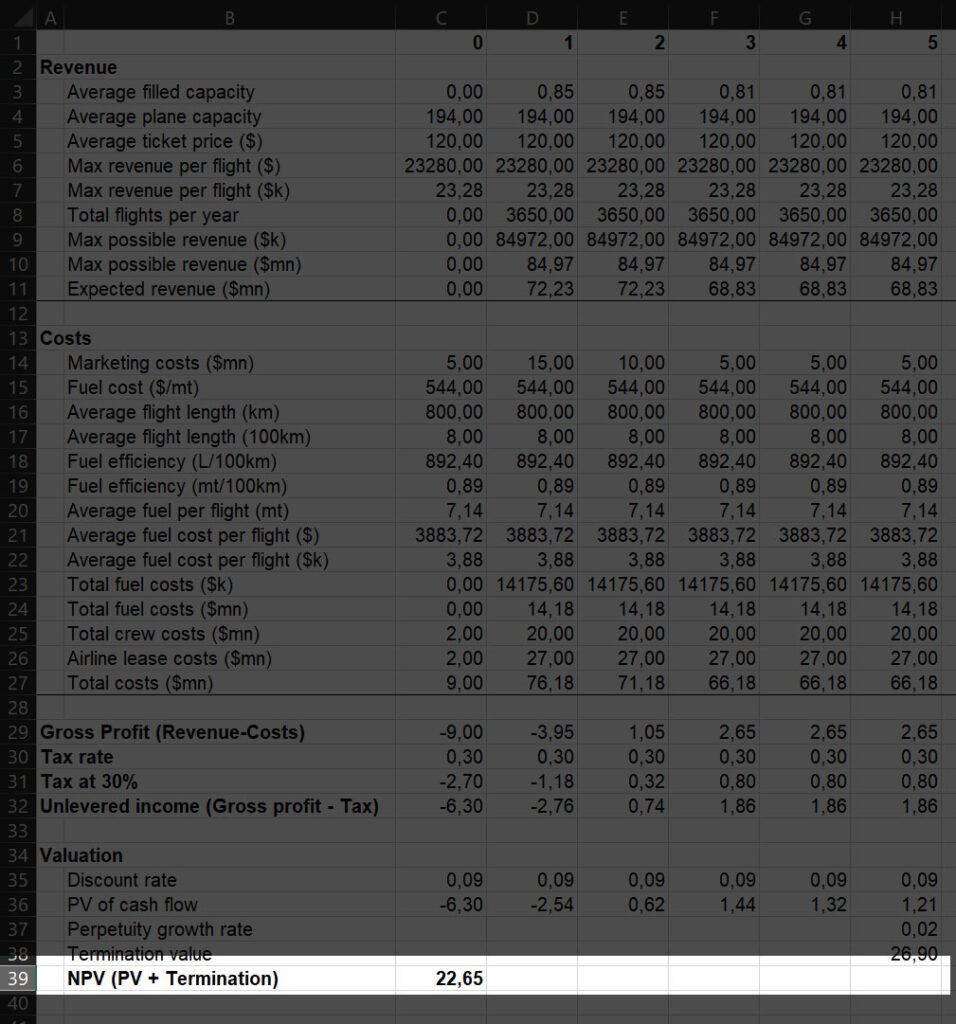
Congratulations! This project has a positive NPV of 22.65 million dollars. By undertaking this project, Amazon valuation will increase of 22.65 million dollars right now. So, is it worth undertaking, right? Hold on a second tiger! Yes, it is true that this is a good project, but is it the best project? Amazon will have many different investment opportunities, and relatively limited cash to use. If there are other projects providing the firm with better NPV, those should be pursued first. In other words, use NPV to rank projects. Use NPV, and no other value, because it considers not only profitability but also volume (would you rather want a 20% return on one million or a 200% return on one dollar?).
We know that Amazon consistently tries to enter into new lines of businesses to leverage their economies of scale. Since at the moment of writing they have not started an airline, we can assume that they have evaluated it as a negative-NPV project (not worth pursuing), they have better opportunities with higher NPV, or they did not evaluate it at all.
Check the Excel for Yourself
If you want to dive deeper into the Excel file of the previous screenshots and check the calculations, you can download it for free here.
Learn More about NPV in Project Management
NPV is a powerful indicator to tell which projects to pursue, or if a project is worth pursuing at all. It is the most powerful financial tool you could use to guide the endeavors of your firm, so you should use it. This guide about NPV in project management may have seemed long, but truth to be told is just the tip of the iceberg.
If you want to learn more, I encourage you to read an entire book about Corporate Finance. This will explain you all the intuition (and calculations) that lead you to the NPV, and even beta calculation. You should read Corporate Finance by Berk and DeMarzo.