Welcome to the definitive guide to Python in Excel. Whether you are new to Python, new to Excel, or both, this guide will make you an expert. We have 33 chapters, and over 40 examples to uncover all the beauty of Python in Excel.
I am Alessandro Maggio, a Program Manager who uses (and loves) Excel a lot. We really, truly, deeply needed Python in Excel: finally Microsoft made us happy. I was feeling like this when this was first released in August 2023, and I hope you feel the same for this guide.

Stick to the end to connect with me on LinkedIn!
We have a lot to cover, so here’s the table of content.
- Introduction to Python in Excel
- How to use Python in Excel
- Python Crash Course
- Advanced Python in Excel
- Conclusion
Introduction to Python in Excel
What is Python in Excel?
Microsoft Excel is a productivity software that helps you to arrange data in tables, manipulate, and analyze them using formulas. People and businesses of all sizes use Excel to produce financial forecasts, do expenses reports, plan projects, estimate how many products they need to sell, and so on.
Until August 2023, Excel had a big problem. Excel did not support advanced programming logic to elaborate data. This was really a shame, because what you could do with simplicity and just a few lines of codes in any programming language required nasty arcane formulas in Excel. Even Visual Basic for Applications (VBA), the programming language native in Excel, could not compare to modern programming languages.
Enters Python. Python is a powerful language, simple, easy to learn, and with a lot of built-in modules for data analysis and presentation. It quickly gained popularity with data scientists, software developers, and any profession that is even remotely related to coding. Wouldn’t it be amazing if we can combine the power of Python in elaborate data with the power of Excel to arrange, structure and get data? Now, we can.
August 22, 2023 marks history for any business consultant. This is when Microsoft released Python in Excel (in preview mode). Since this date, all Microsoft 365 subscribers – both personal and business – can use Python in Excel. That is, you can write Python code in Excel formulas, and Excel will interpret it correctly. You can even use Python to plot charts inside Excel!
If you worked in Excel at a professional level, this should get you excited already. If not, you either haven’t worked enough with Excel to feel the pain of a lack of Python, or you don’t fully grasp the power of Python just yet. This is what the next section is for.
Advantages of Python in Excel
With Python in Excel, you can do the same things you were doing before without it. That is, you can do the same analysis and produce the same outcome that you used to do in the past. Maybe, now you can achieve some slightly better presentation, as in better aesthetic of charts. What’s all the fuss about then?
The power of Python in Excel is that you can do things significantly faster than with either native Excel formulas or with VBA. And I don’t mean the computer is faster, I mean you are faster to create the analysis. This is because Python code is much cleaner to read than Excel formulas. After all, Excel formulas were designed to be crammed in a cell within Excel. Python code was designed to write real software, and to have entire files purely written in Python.
All this translates into a set of clear advantages over traditional Excel, even considering when you have VBA macros enabled.
- Python code is easier to read, troubleshoot and debug than Excel formulas. This means you can add more complex logic without blowing up your file.
- Python code is much faster to write than VBA code, it has a larger online community and support all features of modern programming languages, such as classes. This means your logic can quickly become super-advanced without unnecessary complexity.
- You can use Python to create plots and write Python code to define the appearance of those charts (colors, sizes etc.). This means the style is much more portable from one chart to the next, or even between different files.
- If you already know Python, you don’t need to spend extra time learning how to do the same thing in Excel or VBA. Since Python is easy to learn, even if you don’t know Python, it will be easier to learn it rather than memorize a lot of Excel formulas.
- Python in Excel is natively enabled, and you just need a formula to use it. This is different from VBA, where you first need to change the file extension from XLSX to XLSM, enable Macros, and then open a VBA editor that still feels like Windows 95.
But having Python in Excel is not only better than having Excel without Python. It is even better compared to creating your own Python scripts outside of an Excel file, and for multiple reasons:
- Python in Excel runs on Microsoft servers, and not on your computer. So, you don’t need to spend time setting up an environment which then does not work if you move your file to another computer.
- You can just write Python code inside Excel cells and access all the data you have in the file. No need to spend time importing and parsing the Excel file.
- You can mix Python with Excel formulas already present in Excel.
- You can work with Python while you work in Excel. Without this, you either have your Python script editing your file, or you opening and looking at in in Excel, not both at the same time.
Hopefully, this convinces you that having Python in Excel is a quantum leap forward. No reason while you would not learn it, so let’s get started!
Get started in under 1 minute with Python in Excel
If you are already familiar with Python and already familiar with Excel, you can get started in under 1 minute. If you are new to either (or both), you may struggle to read through this section. Don’t worry, we have a more detailed guide moving forward (worth reading even if you are an expert).
Python in Excel is currently in preview mode, so it means it is not enabled by default. You need to have an active subscription to Microsoft 365, and have preview mode enabled. If you don’t have and don’t want Microsoft 365, scroll at the end of this guide for alternatives. If you do, but don’t have preview mode enabled, read “Enabling Python in Excel” just a few paragraphs below.
Okay good, now you have Python in Excel enabled. How do you use it? Simply put, use the PY Excel formula to write any Python code in it.
=PY(<Your Python code goes here>)Note that normal formulas start and end with brackets. Python, however, changes how Excel interprets the cell. So, once you write =PY( you can start writing code, and instead of closing brackets you hit Ctrl + Enter to complete.
Inside Python in Excel, you can use the xl() method to access Excel ranges. Those are returned as Python values for individual cells, or lists for arrays and ranges. This method accepts one string parameter, the definition of the range you want to fetch, for example:
xl(“A1”)
xl(“Sheet2!B5:C8”)
xl(“my_table[My_header]”)
Combine this inside the PY function to write some Python logic, for example this will return the value of A1 multiplied by 5, and will fail if A1 is empty (rendered as “None” value into Python).
=PY(xl(“A1”) * 5)You can write multiline statements inside your PY function, use if-else logic, loops, and even functions, classes, and some external libraries that Microsoft makes available for you (like pandas and matplotlib).
The PY function returns to Excel the value of the last statement and displays that in the cell. For example, the following script will return the value “Hello John!”.
=PY(
full_name = “John Doe”
first_name = full_name.split()[0]

“Hello “ + first_name + “!”
)
You can use variables and names you define in another =PY() function in another cell. Since Excel will process this top down, define any file-wide Python code (such as constants) in the cell A1 of the first sheet of the file.
With this, seasoned Python professionals with some Excel understanding should be good to go and explore the power of Python in Excel. Yet, going through the full guide will uncover all the secrets that Python in Excel has to offer. Let’s get started!
How to use Python in Excel
Enabling Python in Excel
The first step we need to do is to check if Python in Excel is Enabled. You can do that by writing =PY(1) in any cell in any Excel file. This will show “1” in the cell if Python is enabled, or will show an error if not. If you see the number “1” in your cell, you are good and you can proceed to the next section. If not, keep reading here.
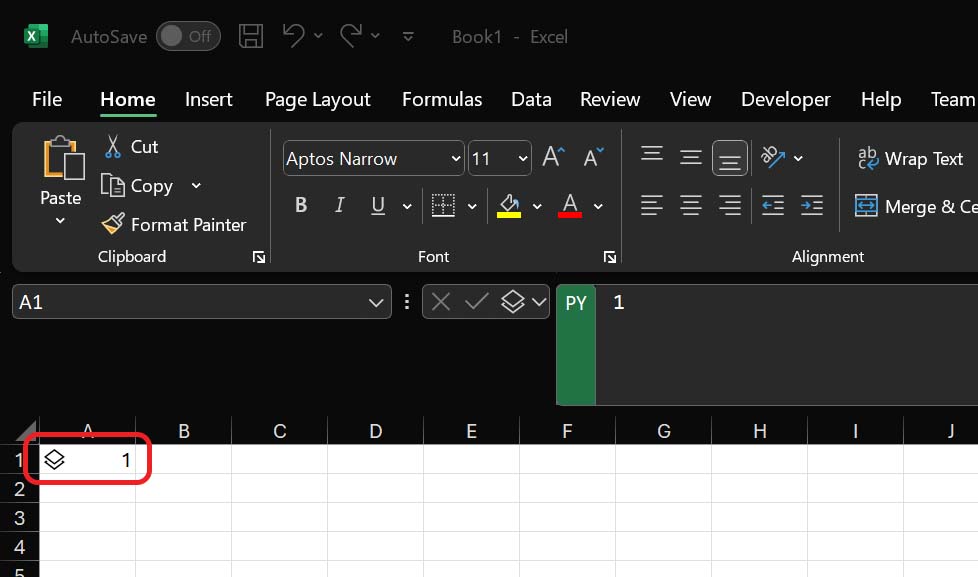
Note that this may require a few seconds, during which the #BUSY error is displayed (as Excel is sending your Python code to Microsoft’s servers).
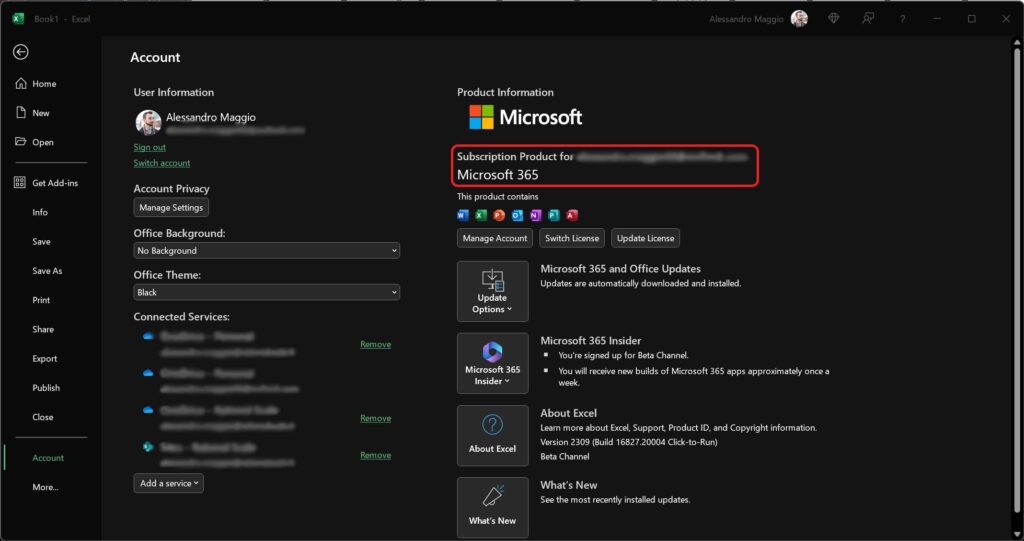
Let’s assume this is not working: it means Python in Excel is not enabled. First, you need to be sure you have Microsoft 365 with an active subscription: a lifetime license for your PC, for example Office 2019, is not good enough. After all, Microsoft is giving you their servers for your computations every time you need them, so a subscription model makes sense. You can check if you have an active Microsoft 365 subscription by going into File > Account. You are looking to see if you have a “Microsoft 365” subscription here.
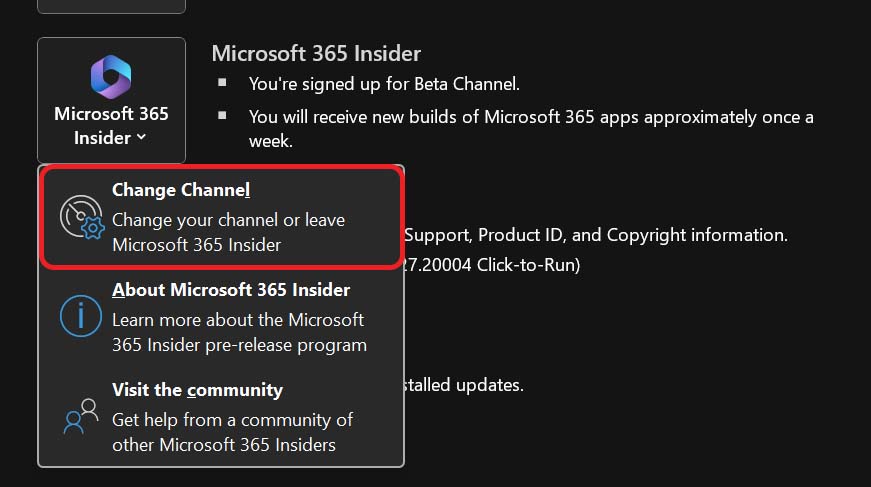
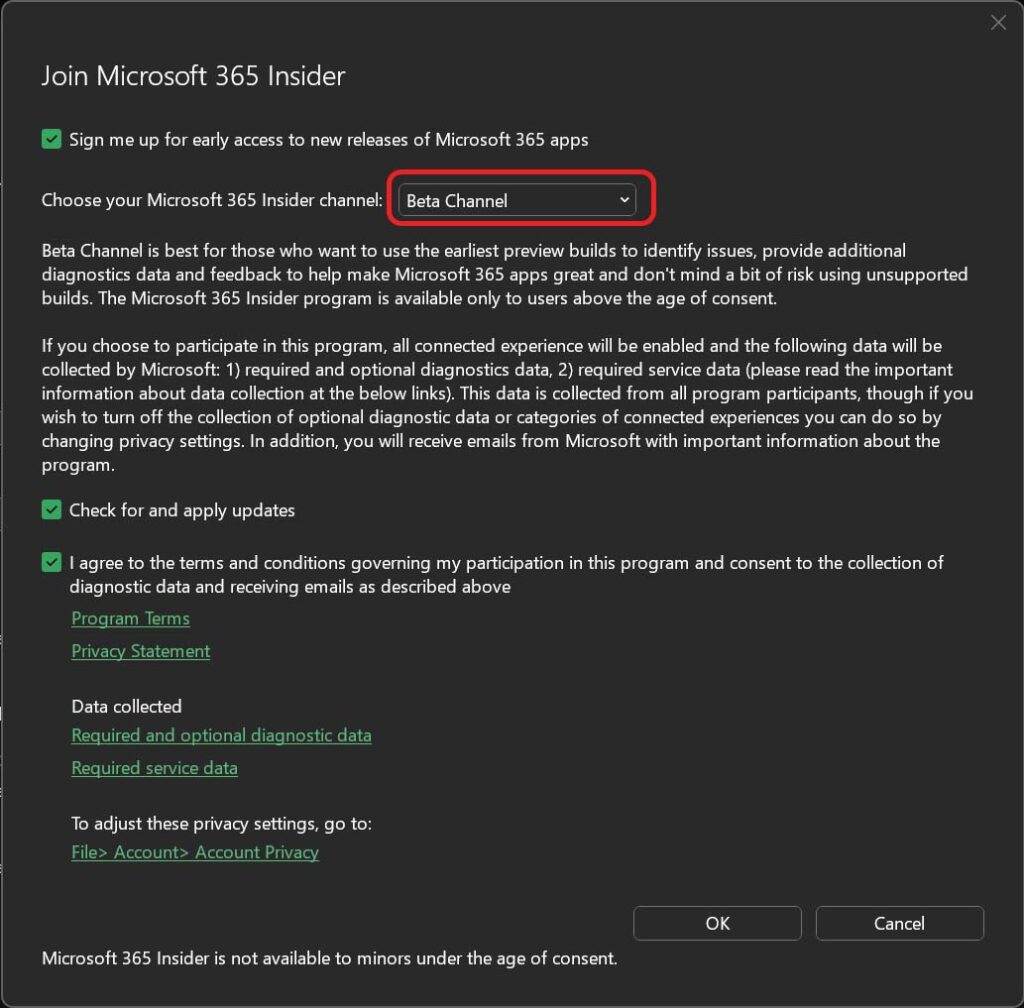
If you have, and yet Python in Excel is still not working, it means this feature is still not available as a mainstream feature in your country. You can enable it by opting in for the beta preview, which means you will get new features faster (even if they might be buggier in the beginning). From the same screen, go in Microsoft 365 Insider and then Change Channel.
Here, you need to select the Beta Channel and tick all boxes. Once you are done, click OK, and you will download some updates and may need to restart Excel.
Once all this is done you will have Python in Excel completely enable and ready to go.
How does Python in Excel work?
Before we start writing Python code inside Excel, let’s spend a few seconds to understand how this works under the hood. It will make future troubleshooting much easier.
Microsoft decided to use Anaconda as the underlying engine, instead of vanilla Python. This means you will write Python code, which will be interpreted by Anaconda. Anaconda supports all native functionalities of Python, plus it has some additional features and better performance. All this is transparent for you, what this means is that you write Python code, and it “magically” gets executed.
The real point to keep in mind is that the Anaconda engine is not on your computer, but on Microsoft’s servers. So, whenever you write Python code, the code that you write is sent to the Microsoft’s servers in some datacenter for them to elaborate it. This along with the data it needs to elaborate that are part of the file. This means you need a constant Internet connection if you want to use Python in Excel.
Saying we send data to Microsoft servers is imprecise. In reality, it is not like data is on your computer and it gets sent to Microsoft. Your file is already in OneDrive as part of Microsoft 365, so the data is already there, and Microsoft just needs to process it, rather than simply storing it.
Other than having constant internet connection, it means some elaborations may require a few seconds and will not appear immediately. When this happens, you get the #BUSY error to indicate Excel (and Microsoft’s servers) are busy processing your request, and you should expect some result soon, as long as you remain connected.
The =PY() formula
“PY” is short for Python. In fact, if you write some Python file (regardless of Excel), its extension is “.py”, much like a Word document will be “.docx”. This =PY() formula in Excel allows you to write Python code, and it works differently from any other formula you might have seen so far.
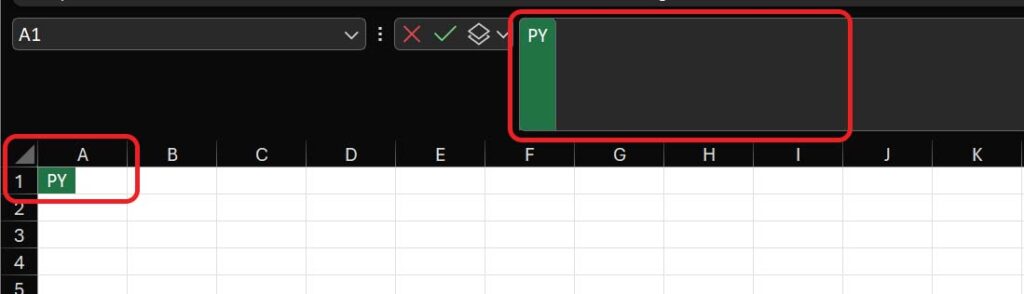
To use this formula, you write in an empty cell not containing anything else, and you simply write =PY and then open a bracket (thus writing =PY()). This will tell Excel that this specific cell will contain Python code, and not Excel formulas. You can see the difference in the input box, because it is marked with a “PY” statement next to the text.
When you complete a normal formula in Excel, you need to close the bracket you opened. Not in this case. With PY, you simply write Python code, and when you are finished you hit Ctrl + Enter. This will finalize the code you wrote, and will send it to the Microsoft servers for elaboration.
Inside, you can write any Python code that you want. If you are unfamiliar with Python, in the next chapter of this guide we will teach you all the basics of Python you need. For now, let’s try to follow along with this example.
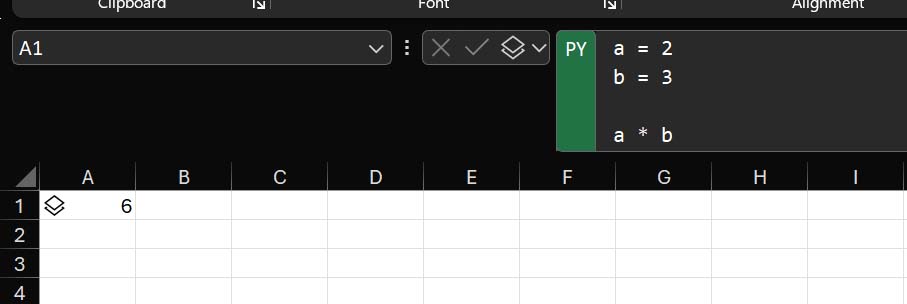
We wrote a 3-line piece of Python code, using two variables: a and b. Variables are just “things with a name” that act as a container for values. The value they contain may change over time. In this case, we put the value of the number 2 inside a, and the value of number 3 inside b. Then, we execute the multiplication between a and b. Since this is the last statement that gets executed, this is what Python will return. For your convenience, here is the exact Python code we wrote in Excel:
a = 2
b = 3
a * b
As you saw in the previous picture, this code returns the value of 6, which is the product of 2 * 3 (the current values of the two variables).
The xl() function to access Excel data
Python in Excel is powerful, but it would be useless if it can’t access or read data from other cells. Of course, it can, we just need to use the proper function.
Inside any Python in Excel code, we can use a special xl() function that Microsoft makes available. This function wants to know an Excel range, such as the name of a cell or group of cells, then go get the value of that cell. The easiest way to use it is starting with the name of the cell we want to target. For example, we can rewrite the previous example to get the value of a and b from two cells (A1 and B1 in this case), instead of statically writing the values inside the Python code.
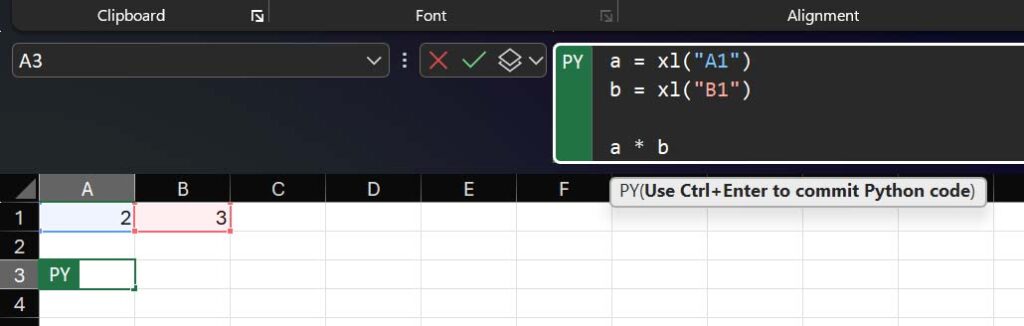
As you can see here, Excel colors “A1” and “B1” of blue and red respectively, both inside the Python code and in the cells in the spreadsheet. This is to show you that references are working, and Excel is indeed getting the value from those cells. As before, the result of this code, which we copy below for more convenience, is 6.
a = xl("A1")
b = xl("B1")
a * b
Note the syntax of xl() function. It needs a parameter, an input to provide within the brackets. That input is the name of the range we want to target, and it is a Python string (which simply means piece of text). To make Python understand we are just providing a piece of text rather than other Python code, we quote it. In this way, Python knows everything between quotes will just be a piece of text and must be treated like so.
But xl() does not have to reference just a cell. It can reference a range of multiple cells, either a row, a column, or a matrix. In this example, we reference an entire matrix.
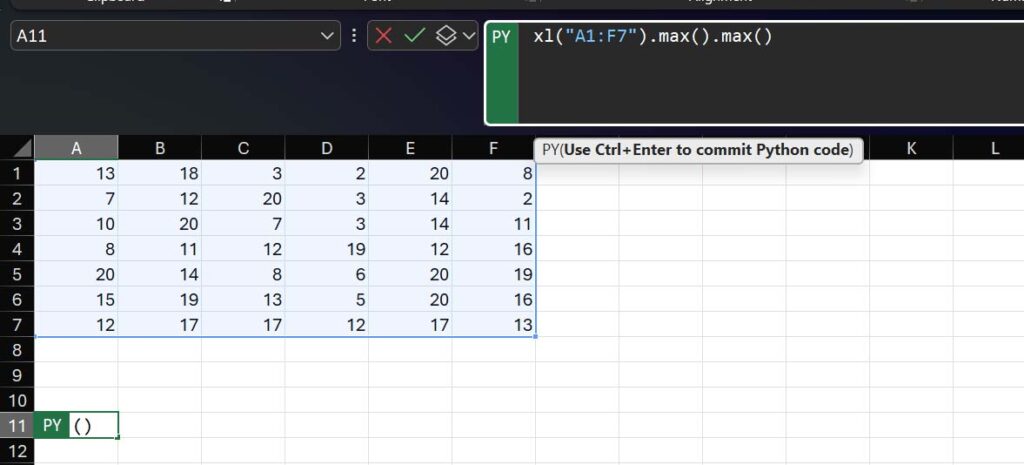
For your convenience, here is the code we used in this example. This fetches the maximum value of the matrix. Or, more correctly, it first find the maximum value of each column, and then finds the maximum value among those (this is why we use .max() twice). The result, based on this data, is 20.
xl("A1:F7").max().max()You can use the mouse to apply a range to the xl() function. If you are starting to type inside a PY block of code in Excel, and your cursor is inside that cell, then you can click on any other cell with the mouse. If you click on cell C4, for example, it will automatically add xl(“C4”) to your Python code where your cursor is. If you select a larger range, for example A1 to F7 (you can do that by clicking on A1 and then using arrow-down and arrow-right while holding shift), it will add xl(“A1:F7”). As you move with the arrows to expand or reduce your range, the output will change to reflect the range you are selecting.
What does the xl() function return? Primary values, or Pandas Dataframes. Whenever we use the xl() function, it gives us back a value. If we are using xl() to select a single cell, it will give us back the value of that cell. That can either be a number (integer or floating point), a string (piece of text), or “None” (a special Python value to indicate there is no value).
However, when we return a range that contains multiple cells, we get a Pandas Dataframe. Pandas is an additional module available in Python to manipulate data, very popular among data scientists. A dataframe is just a “table-like” structure in Python, that comes with nice features that Pandas provide. For example, as we have seen, it has a quick way to find the maximum value, but also minimum, average, and so on. Just know this for now, we will see more on Pandas when we get to Advanced Python in Excel later in this guide.
Accessing tables with xl()
In Python in Excel, you can use the xl() function reference any range. That may be a range of cells defined by cells names, an entire row or set of rows or columns, a named range in the Name manager, or a table. In other words, you can reference any part of Excel much in the same way as you would with a normal Excel formula.
Particularly, we have two options for tables. On one side, we can simply use the table name, on the other we can use the table name with [#All] notation. Let’s go in order.
In this example, we simply refer to the table (shown in the picture) that is named products. We just use the standard xl() formula and we reference the table by name.
xl("products")Once you write the code and hit Ctrl + Enter to submit it, you will see there is an icon in the cell that contains the Python code. This icon represents a stack, or set of layers one on top of another. That’s the one highlighted in red. If you click that, it will open a tooltip that will show you what is the Python value we are returning, as an Excel cell cannot show complex data structures by itself. In this example, you see we are getting all the values in the table but we don’t have information about the headers (which are just replaced by numbers).
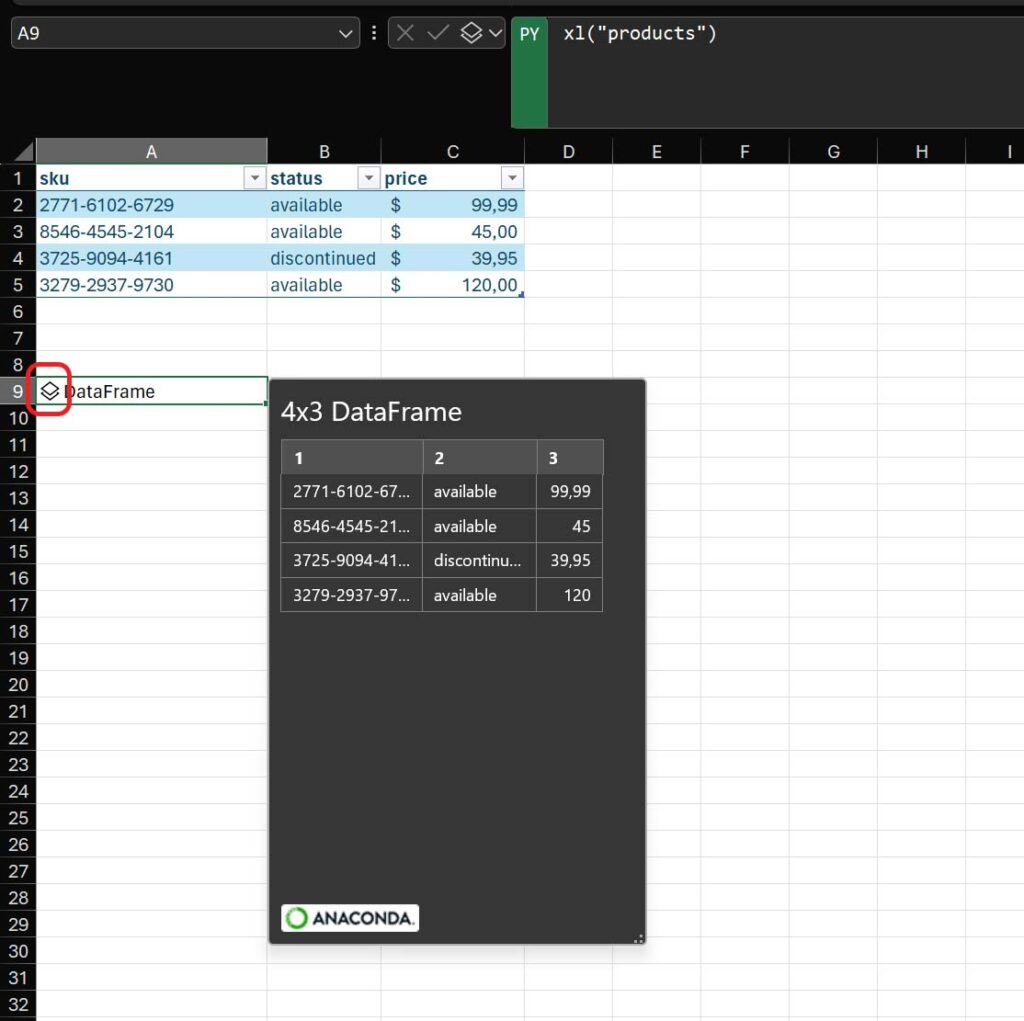
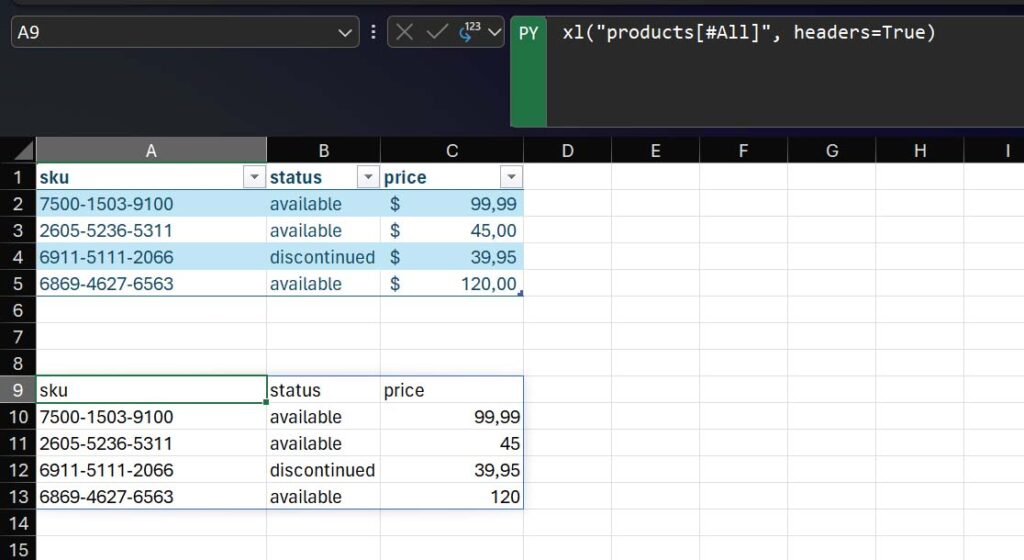
If we want to get also header names, we need to use the notation [#All] to tell Excel to include also the headers. However, since now the first row is not part of data, but it represents the header, we want to be sure Excel understands that. So, we provide the additional parameter “headers” and set it to True. In this way, Python in Excel will know that the first row is to be used to name the columns.
xl("products[#All]", headers=True)Indeed, if we hover on the stack icon next to the cell, we will see the headers of the dataframe instead of the numbers.
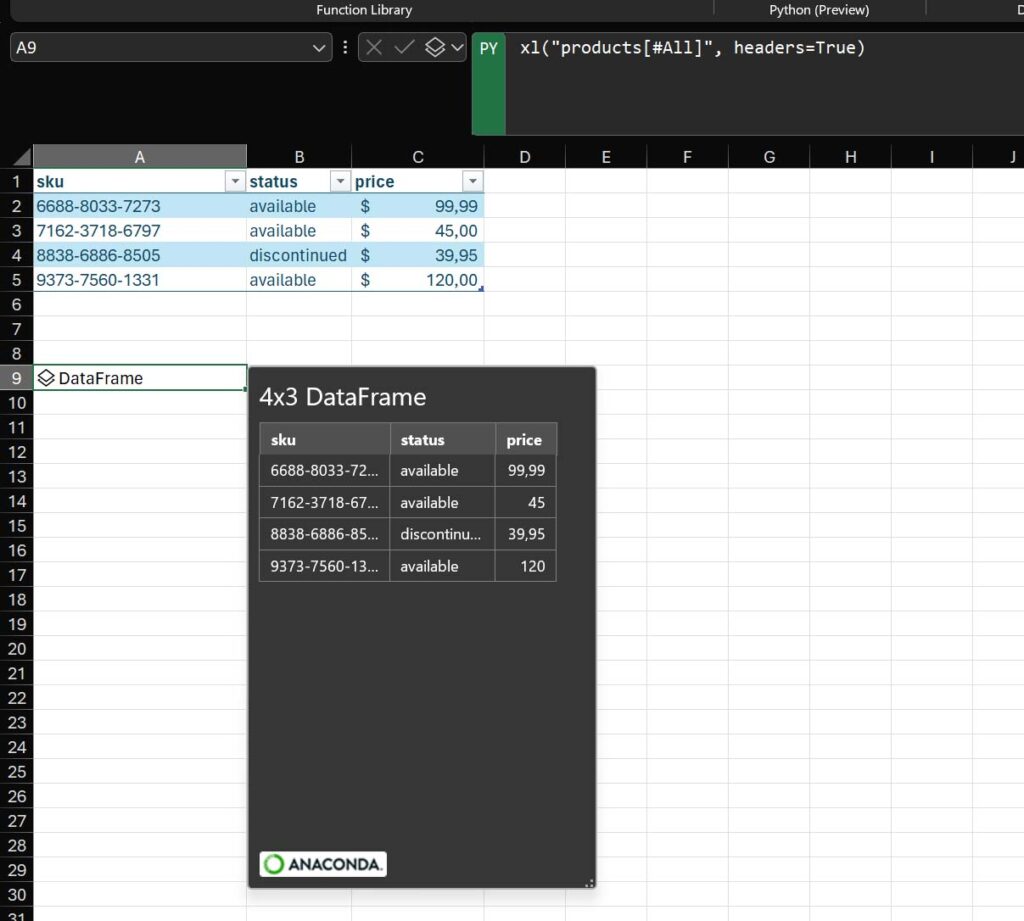
If we don’t set the headers to True in the xl() function, then Excel will just assume the first row is part of the dataset. As a result, we would get the numbered columns as before (1, 2, and 3), and have as first row the header (sku, status, price).
Python Output vs. Excel Value (Return Arrays and Matrixes)
In the previous example, we saw that we are targeting with xl() an entire table. However, in the cell where we write Python in Excel code, we do not see the entire table returned, but just a piece of text “Dataframe”. What if we want to return the entire table, and display it in multiple Excel cells?
With traditional Excel, we can do something similar using array formulas, special formulas that instead of returning a value return a list of values. If they return those values in the shape of a column, then all the cells below the one where you write the formula are populated with this content. If your array formula returns a row, all the cells to the right of where you wrote the formula will be populated. And, if it returns a matrix (columns and rows), Excel will populate to the bottom and to the right. Of course, the cell where you write the formula is always populated and acts as the first item in the list.
With Python in Excel, we can do something similar. We have a way to display Python dataframe across multiple cells in Excel. To do that, we simply need to change the return type.
Let’s take the example from the previous section. Next to the box where you type your Python in Excel code, you have a dropdown where you can select if you want your return to be a Python object or an Excel value. By default, it is going to be Python object, but you can change it.
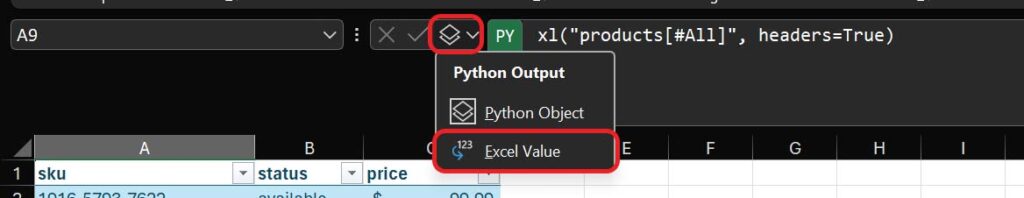
Once you do that, you will see that the return expands to show the entire table, and populates it across multiple columns and rows.
If you have your cursor in the cell where you wrote the Python formula, note that Excel will highlight in a box all the cells that are getting a value because of this formula. In our case, cells from A9 to C13 are affected. And, as you can see, the stack icon to represent the Python object is not there anymore. This seems like any normal array formula in Excel now, except it is running Python in Excel natively.
Handling Errors
Python in Excel brings a new set of errors that were not present in traditional Excel. It is worth dedicating some time to understanding them.
The first new error in Python in Excel is #BUSY. If you get this in a cell, it means Excel and Microsoft servers are busy running your computation. You just need to wait, this is a transient issue and not lasting much – except to have this error for a few seconds every time you write new Python code, or every time you refresh data that warrant a re-computation by Excel.
#BUSY means Microsoft servers have accepted your request and are processing it, you have an open communication with them. In other words, if you have connectivity problems, it is not #BUSY the error you will get (you will get #CONNECT instead). Overall, as this is a transient error and it is part of the nature of Python in Excel, it is not worth spending time troubleshooting it.
The most important error in Python in Excel is #PYTHON. When you get this error, it means there is something wrong in your Python code. You may have a typo, or some other form of faulty logic that is preventing your code from working. In this case, I recommend doing two things for troubleshooting:
- Use a Try-Except block to return the error to Excel, set the return type to Python object and over the stack icon to see the content of the error (if you are unfamiliar with Python errors or Try-Except, they are explained later in this guide).
- Copy your Python code into a separate python file, run it on your computer (outside of Python in Excel) and debug using a proper coding editor, such as Visual Studio Code or PyCharm. To do this, you will need to mock the xl() method. That is, created a “fake” xl() method that returns what you need. This is more advanced troubleshooting, reserved for real programmers.
Cross-referencing objects
In Python in Excel, you can reference other Python objects such as dataframes from your Python code inside the =PY() formula. This can become helpful to do advanced data manipulation. To say it even simpler, if you return a Python object in a cell, another cell with Python code in it can take that object and read it.
Let’s take the table example we have been working on in the past few sections. Here, we switch back our original return in A9 to Python Object (rather than Excel value). At this point, we go in another cell, A12, and write the Python code with =PY() to reference the A9 range. Note that the A9 range contains the Python dataframe that represents the entire table. In A12, we set the return type to Excel value, and voilà. We have returned the table as Excel value, not by referencing the table directly, but by referencing the dataframe.
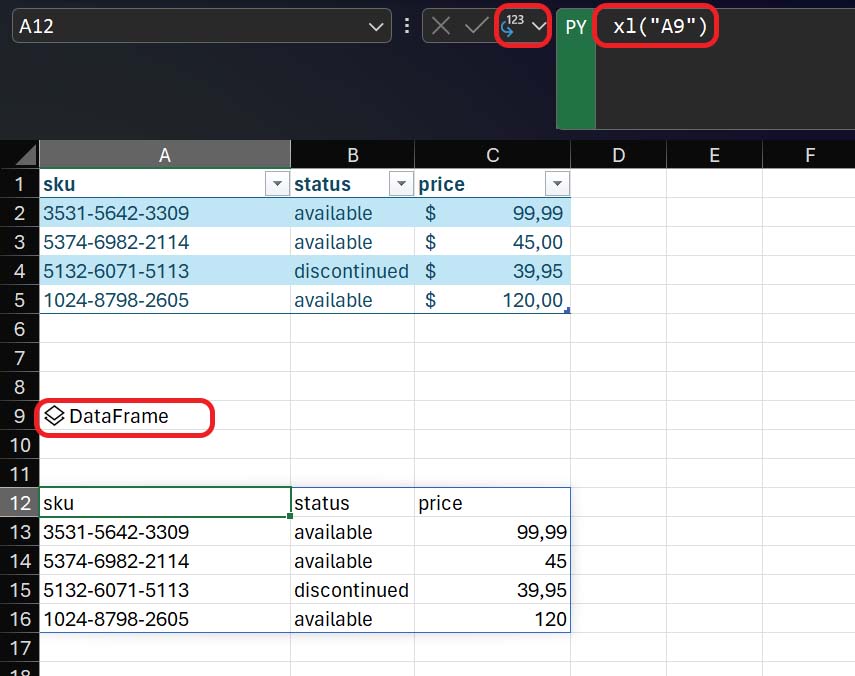
This is useful, because we can add multiple intermediary steps that reference dataframes or other Python objects, extending the functionality of Python in Excel.
Python Crash Course
If you want to use Python in Excel, you need to know how to use Python in the first place. That is one of the easiest programming languages to learn, if not the easiest altogether. If you are not already familiar with it, you can learn python today in this course. In fact, we have two options for you.
If you have more time (about 1 day, or 8 hours), take our ultimate (and free) Python course. This will assume anything, will start from the very basics and will build with several lessons bringing you to quite advanced concepts. It is completely free, and as a bonus you will know Python not only in Excel, but in general.
Instead, if you are in a rush and want to learn Python specifically for Excel, keep reading here. This section will give you all the tools you need to work effectively with Python inside Excel. Here, we will not install Python in your computer, but test everything inside Excel, thanks to Microsoft’s servers running the code for us.
Algorithmic logic
Python is a programming language, and just like any other programming language it relies on algorithmic logic. This is a type of logic, or approach to problems, where you define tasks as a set of repeatable steps. An algorithm is nothing more than a specific set of instructions with no ambiguity and that can be repeated in the exact same way.
We normally represent algorithms as flow-charts, because this logic is generic and not specific to Python: it can be implemented with any programming language. A classic example of this is a cooking recipe. After all, a cooking recipe is a set of steps to execute in a specific order. Let’s make an example with the recipe of a boiled egg.
To make a boiled egg, you have to make the water boil, and then put your egg inside of it and cook it for 4-5 minutes if you want it dippy/creamy, or 6-7 minutes if you want it more solid (according to BBC good food). How can we translate into an algorithm? Let’s put this series of steps into an algorithm flow chart. In such flow charts, start and end are ellipses, while tasks are rectangles.

This is not very deterministic if we think about it. What does it mean “boil water” after all, how long should it boil? Different people may interpret this differently, and the same is true for “cook egg”. We can be more specific with times, and also insert conditional logic: execute parts of the flow chart based on a decision we make. In this case, the decision is whether we want dippy or solid egg. If we want it dippy, let’s cook it for 4 minutes, if we want it solid let’s cook it for 6. In flow charts, decisions are represented by diamonds.

We can make this flow chart even better. In fact, if you think about it, we don’t want to put the water on max heat for 10 minutes. What we really want is to put it on max heat and then wait until it boils. How can we do that? With an algorithm, we simply need to have a decision “Is the water boiling?” and, if yes, we proceed. If not, we go back to a previous step, in this case waiting for some more. After we waited some more, we check it again, and if it is still not boiling we wait again. This is a loop, a part of the algorithm that repeats itself.

Now we have a solid algorithm, a set of steps that you can easily repeat over and over. As we will see in Python in Excel, but really with any programming language, instead of drawing a chart we simply write code. That is, we transform this flow-chart in a set of written instructions that the computer can understand. And, of course, we do that we things the computer is able to do, such as making calculations (rather than boiling eggs).
We chose this example of boiling egg because algorithms are a form of logic. You can apply them to any problem in life, not exclusively in computer science or Excel.
Variable assignment
The first thing you need to learn to be proficient in Python in Excel is variable assignment. Like any programming language, python has the concept of variable.
A variable is a placeholder, a container that will hold some sort of value into it. The value it holds may change whenever we run the program, and may even change during the same execution of the program (depending on how we structure it). To create a variable, you just type a name, starting with a letter and containing letters, underscores, and/or numbers. You also need to assign a value to it when initializing, that is, you need to tell what the variable will contain.
In a simple example, we can create a variable named “my_variable” that contains the number 5 and another variable named “my_other_variable” that contains the number 10. To assign a value to a variable, we use the equal (=) operator. If we return the value of my_variable in Excel, we will see 5.
my_variable = 5
my_other_variable = 10
my_variable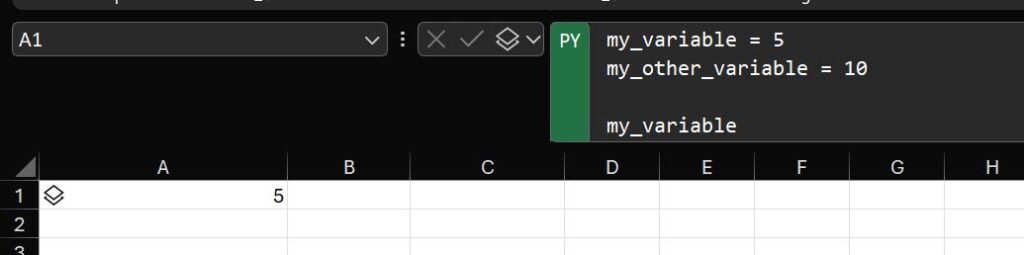
The concept here is simple. Whenever we use the name of the variable, Python will replace it with its content during execution. This means if we make a multiplication of the two variables that we have, we will get 50.
my_variable = 5
my_other_variable = 10
my_variable * my_other_variable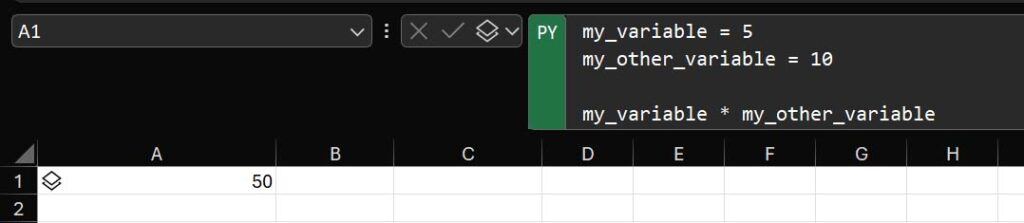
The advantage of this approach is that if you have complex operations you do not need to hardcode all the values inside the operations. Instead, you can use variables and define the values at the beginning of your problem, or more easily import data from Excel (with the xl() function) and store them into variable.
You can reassign the value of a variable, that is, you can put a new value into a variable after you define it. That may be another static value, or the value you get as a result of an operation. In this example, we overwrite the value in my_variable. Before, it was 5, now it is 52 (the result of this operation). The possibility to change the value inside variables enables quite complex logic.
my_variable = 5
my_other_variable = 10
my_variable = my_variable * my_other_variable + 2
my_variable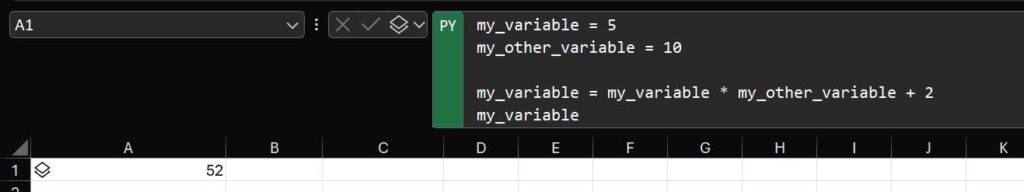
Variables don’t have to contain numbers. They can contain strings (pieces of text, delimited by quotes), integers, decimal numbers, and they can even contain a list of values. In case we want to provide a list of values, we need to enclose this list within square brackets, and separate each value with a comma (we can use either static values or other variable names in those lists).
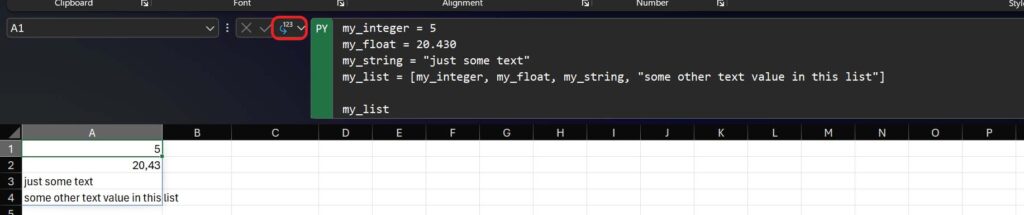
Note that in this example we set the return value to Excel value so that we can see all the items in a list. As you can see, Excel returns them in a column, one after another. We will see how to manipulate lists better when we will cover loops, later on in this guide.
Conditional statements
Conditional statements are a powerful tool in Python in Excel that allows you to execute part of your algorithm on certain conditions. We can think of these statements as “if this condition is true, do this, otherwise do this other thing”. In fact, writing conditional statements in Python is not that different from writing this sentence.
To write a condition, we need to use the if keyword, write the condition that we want to check afterward and add a colon at the end of the line. Then, any subsequent line that is indented below this conditional statements will run only if the condition is true.
input = xl("A1")
result = "Less than 3"

if input >= 3:
   result = "Greater than or equal to 3"

result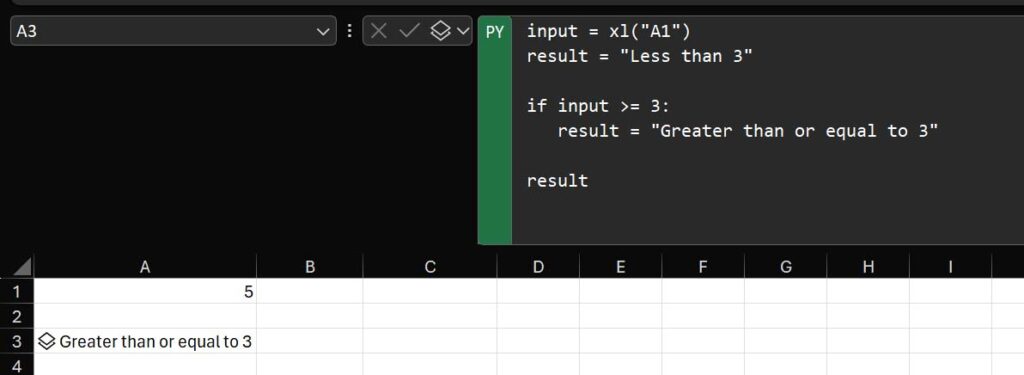
In this example, we load the value in the cell A1 into a variable, then we check if that variable is greater than or equal to 3. If so, we overwrite the result. If not, we leave the result in its original state, and then we show the result in any case (outside of the indentation).
We can also combine multiple conditions in a single statement. In that case, we use the and keyword to join two or more conditions, all of which must be true at the same for the overall condition to return true. We can also use the or keyword, in which case the overall condition will return true if at least one of the joined conditions is true. We can combine multiple keywords with brackets, and even negate conditions using not. To summarize:
true and truereturns truetrue and falsereturns falsefalse and falsereturns falsetrue or truereturns truetrue or falsereturns truefalse or falsereturns falsenot truereturns false(true or false) and trueis equivalent totrue and trueand returns true
The and, or, and not keywords are called binary operators because they work with binary or Boolean value, items that can have only two values (true or false) and are thus called binary.
input = xl("A1")
result = "Not within 3 and 15"

if input >= 3 and input <= 15:
   result = "Within 3 and 15"

result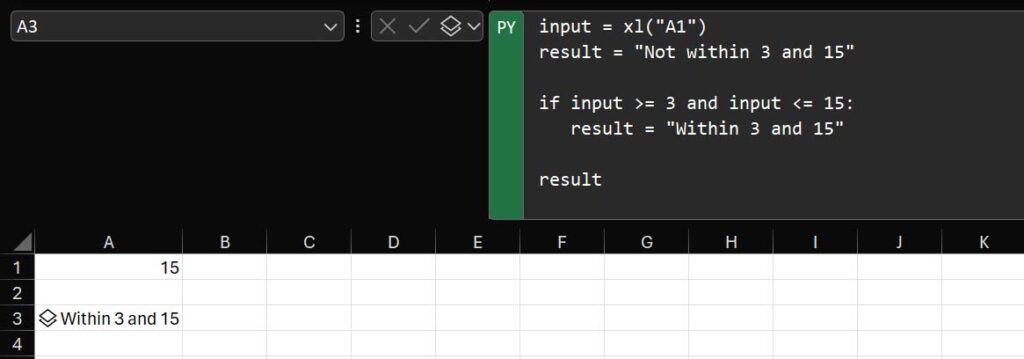
Sometimes, using a single if is not enough. Most of the time you want to do an action if a condition is true, and a different action if the condition is false. In that case, you can use the else keyword to include a different code block.
input = xl("A1")
result = "Unknown"

if input >= 3 and input <= 15:
   result = "Within 3 and 15"
else:
   result = "Not within 3 and 15"

result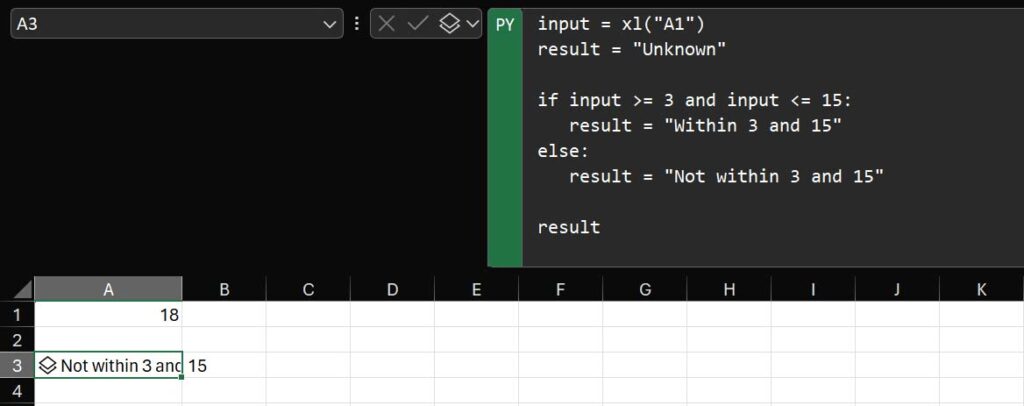
You can also evaluate multiple conditions with the keyword elif. This keyword simply means “if the previous condition was false, the evaluate this one. You can add as many elif statements as you want between the if and else statements of a conditional block.
input = xl("A1")
result = "Unknown"

if input < 3:
   result = "Less than 3"
elif input == 3:
   result = "Exactly 3"
elif input <= 15:
   result = "Greater than 3 and less than or equal to 15"
else:
   result = "Greater than 15"

result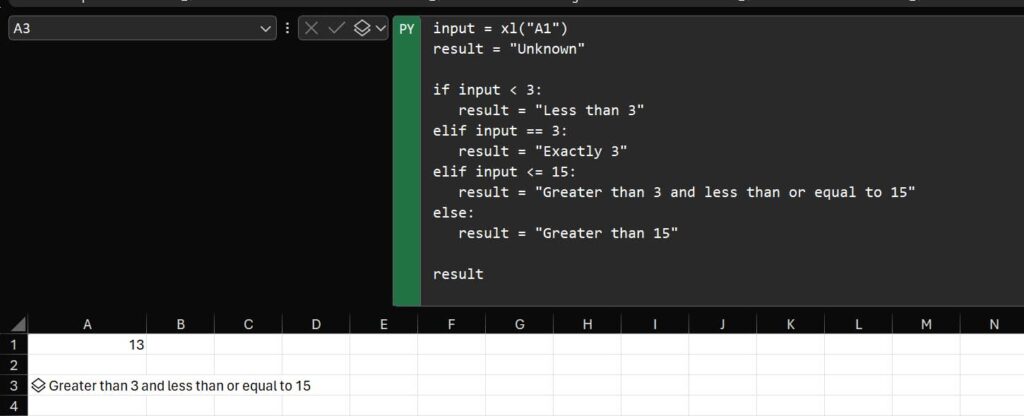
With all these conditional statements, you can implement quite a complex logic. Most of the times, you will use conditional statements in Python in Excel to compare values. So, it is important to remember the operators you can use to compare values. Considering two variables “a” and “b”:
a == bto check if the value of a is the same as the value of b. Note that we are using two equal signs, not one (a single one would override the value of a)a < bchecks if a is less than b, but not equala > bchecks if a is greater than b, but not equala >= bchecks if a is greater than or equal to ba <= bchecks if a is less than or equal to ba != bchecks if a is not equal to b, it is the opposite of a == b
Loops
Python supports loop like any modern programming language, and we can use loops also in Python in Excel. Simply put, loops are like conditional statements that can run multiple times instead than just once.
A loop is a block of code that runs again and again as long as a condition is true, or for a specific number of times. Unlike normal conditional statements, where we have only if-elif-else keywords, here we have different types of loops that we can use.
The easiest loop in Python in excel is the while. It checks a condition, and if the condition is true it runs the code indented right after that. If the condition is not true, it skips the code like a normal if. However, if the condition is true, after executing the code it will check the condition again. As long as the condition is true, it will keep re-executing the code in the block and re-evaluating the condition.
Take a look at this example, we add the letter “a” to the result string until the length of the result is less than 6.
result = ""

while len(result) < 6:
   result += "a"

result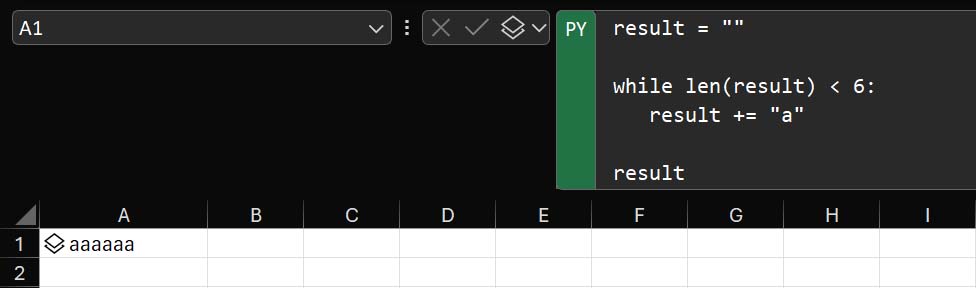
As you can see, it returns “aaaaaa”, or exactly 6 times the letter a. This is because as soon as the length of the result reaches 6, the condition does not evaluate to true any longer, and the code continues outside the loop (just showing the result in this case). It is important that the code inside the loop modifies the variables checked in the condition, so that eventually the condition becomes false. If you don’t ensure the condition becomes false eventually, the code will keep running in the loop forever and will not work.
Loops are extremely useful with arrays (variables that contain lists of items), as you can use loops to process each individual values. We will learn more about this when we cover collections.
Another useful loop is for. This loop iterates over the elements of an array, that is, it runs through this special variable type that contains multiple values and processes values one by one. The syntax is simple, you have to have an array value and indicate a variable name where you want to store each individual value. That special variable will be available only within the for loop, and each run will contain the value of then next item in the collection.
So, the for loop is the best approach to run over a list of elements, but it is less flexible than while.
fruits = ["apple", "banana", "pinapple"]
result = ""

for my_fruit in fruits:
   result += my_fruit + " "

result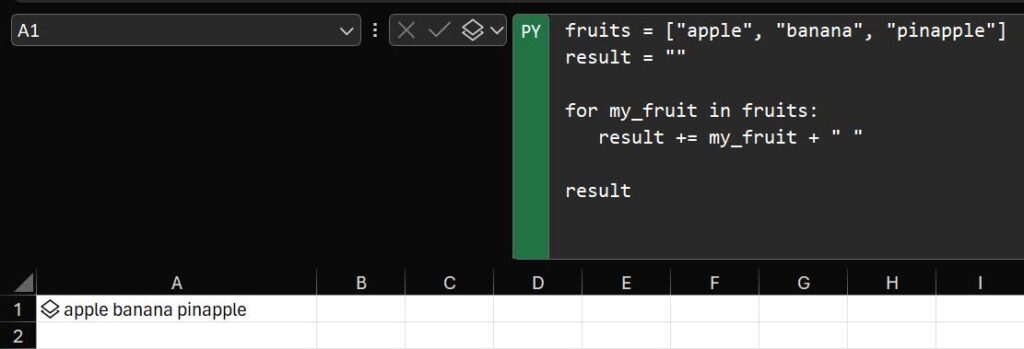
We can also use the for loop to repeat a block of code a given number of times, such as “do something 5 times” (or whatever number suits you). This is a simple trick we can apply in Python, and also in Python in Excel. We can use the range() function, that expects from you a number. This will automatically create a list of items from 0 to the number you provided less 1. For example, if you provided the number 3, range will create a list containing the numbers 0, 1, and 2. We have a total of 3 elements in this list, so we can repeat an instruction 3 times.
result = ""

for n in range(6):
 result = result + str(n)

result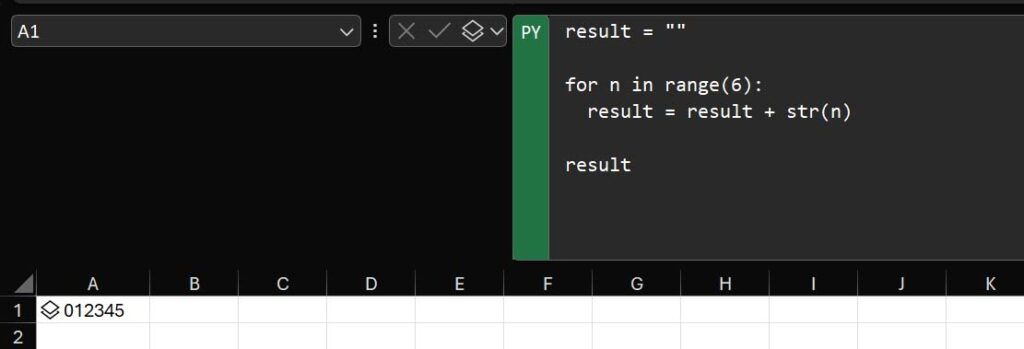
Note that in this example we are chaining the number (n) to the result and then showing the result. However, we are using str(n) to convert the number to a piece of text. If we did not do that, we would sum all the numbers. Instead, here we are simply saying “chain the number to the previous piece of text as if the number was text as well”, so we are not performing any sum.
Loops are particularly useful when we work with collections, lists, or arrays. We will see those in the next section.
Collections
Just like in normal Python, we have collections also in Python in Excel. Collections is just a Python way to say arrays or lists, a special type of variable that does not contain a single value, but rather a list of values.
Since a collection is a list of values referenced by the same name, it means we need to have a way to identify which value we want inside the collection. For example, if we have a collection of 3 fruits named “fruits” we want to have the possibility to reference (get and set) the value of the first fruit, the second fruit, and the third fruit. We also want the possibility to add new items to the collection, or to remove existing items.
We can do all of that in Python in Excel. To define a collection, simply declare a normal variable and provide a list of comma-separated values, grouping all those items between two square brackets. Note that a list can also start empty, with no element in it. In that case, simply open and close the brackets without listing anything in it.
Then, you still use square brackets next to the variable name to reference a specific item in the list. To do that, you need to provide the index of the element. That is, what is the position of the element you are interested in in the list. Note that the first element is at position zero, not one!
fruits = ["apple", "orange", "lemon"]

fruits[1]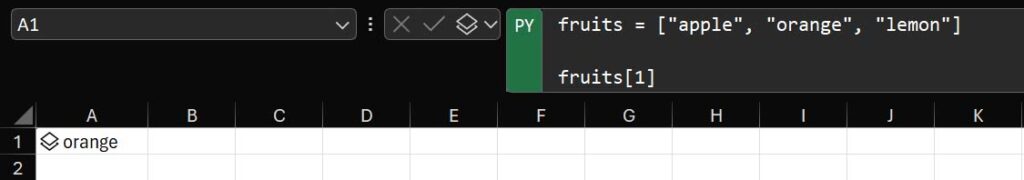
As you can see in this example in fact, we can reference the second element (orange) with the number 1, not the number 2. We can use the same logic to override the value of an element, and we can return to Excel the entire collection.
fruits = ["apple", "orange", "lemon"]

fruits[1] = "pear"

fruits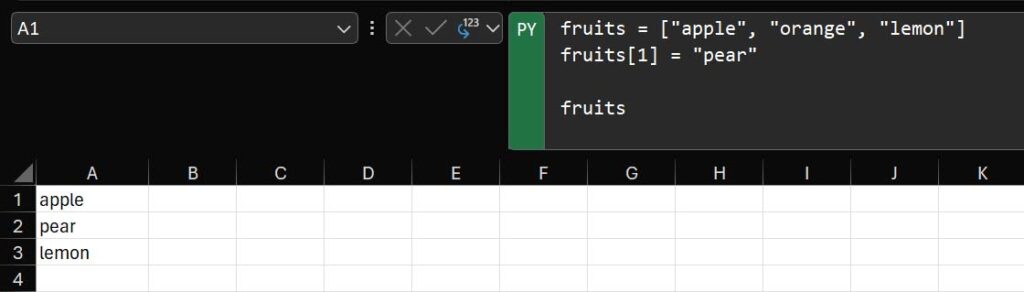
Now that we have a list of items, we can use some list functions to modify their values:
- append(value) to add a new value at the end of the list
- insert(index, value) to add a new value at a specific position in the list, and shift everything that is already in the list from that position onward to the right (if we add at position 2, the new item will be at position 2 and the item that was in position 2 will be at position 3, and so on).
- pop() to remove the last item from the list
- remove(value) searches for a specific value and removes it from the list
- len(list) returns the number of items in the list
Let’s try to use all these methods. We will execute one method to modify the list, store the resulting list inside another list, and then print that list in the end. In this way, we will have a list of list, where each list inside of it is the list after being modified by one of those methods.
Note that here we performed two tricks. Since lists are dynamic objects Python stores them as references. This means if you assign the value of a list to a variable and later modify the list, when you print that variable it will show the modified list, even if modification happens after the assignment. This is because, by default, we are not copying values, but we are pointing to the same place in computer’s memory where the list is stored. To avoid this, whenever we store my_list in output_list, we use the copy() method, so we are sure to copy the values.
The other trick is at the end, when we want to show the length of the list. Since Python in Excel is expecting a list of lists at this point, we are enclosing the numeric length value into a list (between square brackets). It is a list of just one element, as you can see.
output_list = []
my_list = ["apple", "orange", "lemon"]

output_list.append(my_list.copy())

my_list.append("pear")
output_list.append(my_list.copy())

my_list.insert(2, "pinapple")
output_list.append(my_list.copy())

my_list.pop()
output_list.append(my_list.copy())

my_list.remove("apple")
output_list.append(my_list.copy())

output_list.append([len(my_list)])

output_list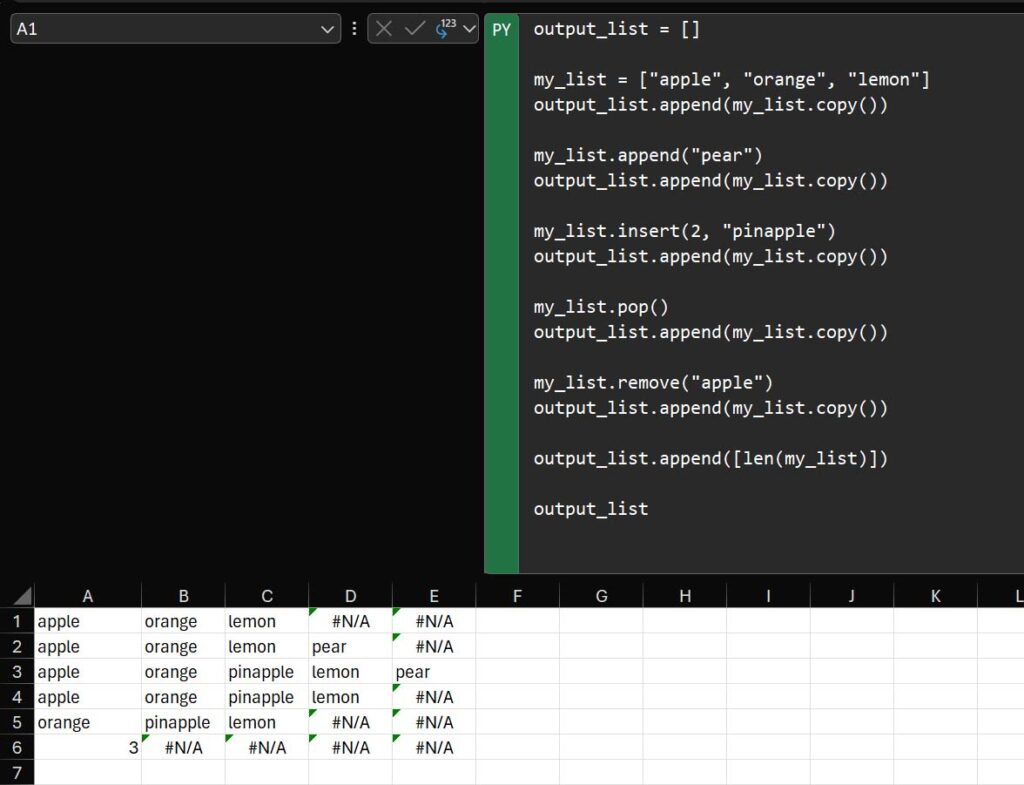
Remember to use loops to iterate through lists. Lists, or collections, are simply numeric sequences of items. But they are not enough if we want to implement complex logic in Python. For that, we need dictionaries, which we cover in the next section.
Dictionaries
We already saw lists in Python in Excel. Dictionaries are somewhat similar to lists, yet somewhat different. A list is a sequence of items, typically homogeneous (it doesn’t have to be, but it is a good practice). In a list, you reference items by number: the first item, the second item, the 10th item, and so on.
A dictionary is also a collection of multiple values assigned a single variable. However, instead of referencing values by number, you reference them by name. We use curly brackets instead of square brackets, we have to define the name of each value as a string (between quotes), add a colon, and then provide the value that we want.
person = {
  "name" : "John",
  "last_name": "Doe",
  "age": 32,
  "characteristics": ["brown hairs", "blue eyes", "glasses"]
}

person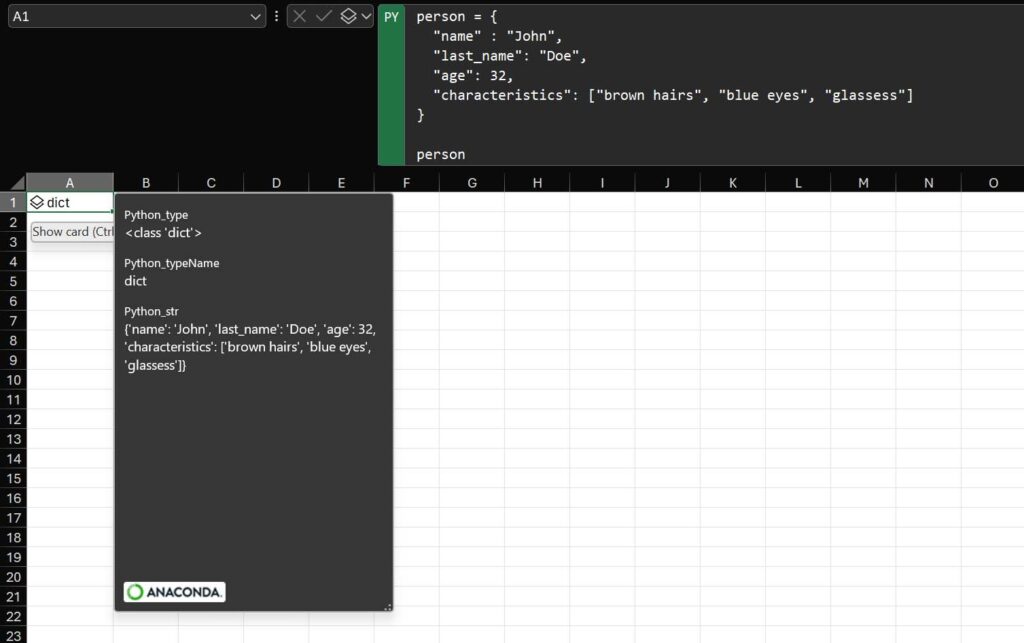
We can also access properties of a dictionary by using square brackets, much like a normal list. Instead of providing a number, however, we provide a string key.
person = {
  "name" : "John",
  "last_name": "Doe",
  "age": 32,
  "characteristics": ["brown hairs", "blue eyes", "glasses"]
}

person["age"]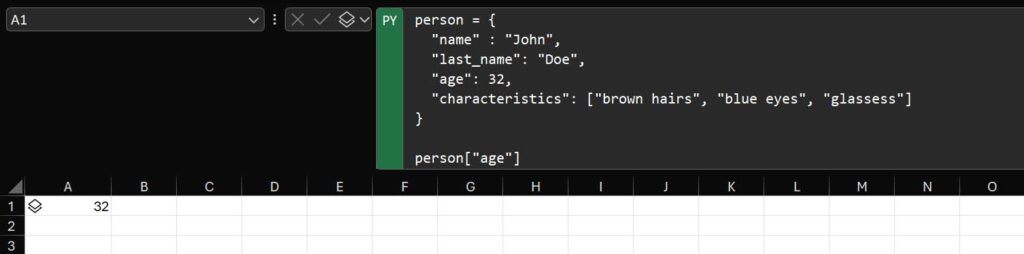
And finally, we can use the same logic to override the property of an object, for example changing the age, or by adding a new property that was not originally present.
person = {
  "name" : "John",
  "last_name": "Doe",
  "age": 32,
  "characteristics": ["brown hairs", "blue eyes", "glasses"]
}

person["age"] = 33
person["title"] = "Mr"

person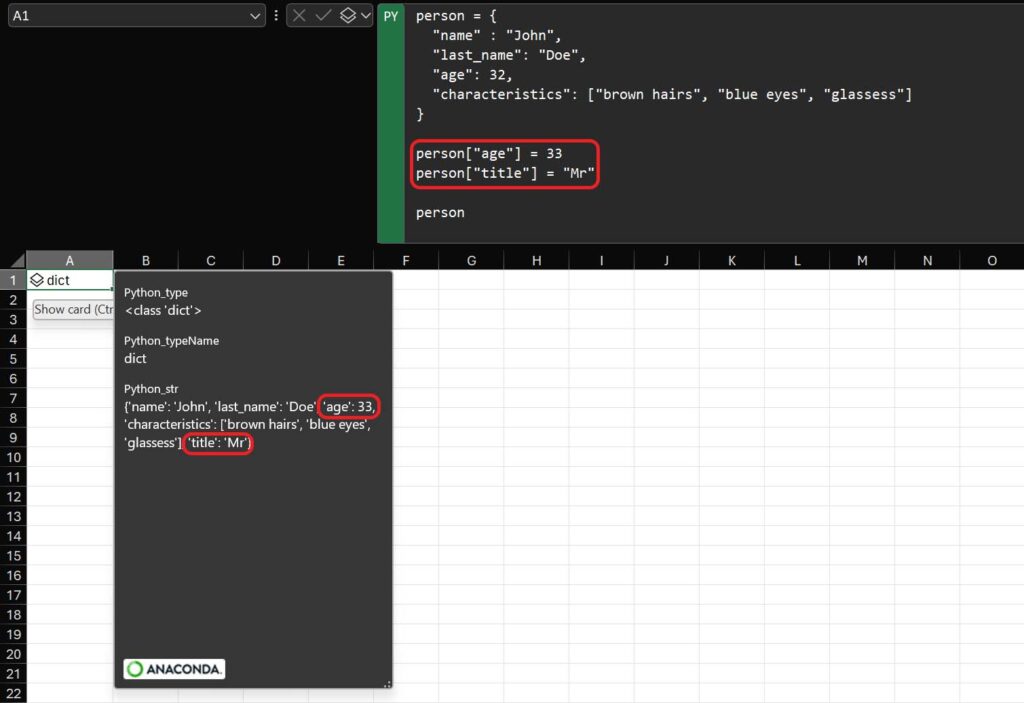
Now that you know all the basic data structures in Python, we can start to see how to operate on them, in a way that works for Python in Excel.
Functions
Functions are an important concept in Python in Excel, just like in any other programming language. A function is a piece of reusable code, that accepts a set of input, performs some operations and gives back some output. The logic is always the same, but the output produced will depend on the input given.
For example, you may want to have a function to create the factorial. If you are not into math, remember that the factorial is the multiplication of all numbers up to a number. So, the factorial of 5 is the multiplication of all numbers from 1 to 5 included (1 x 2 x 3 x 4 x 5). The logic behind this is always the same: we get all the numbers up to the provided number input and multiply them for each other.
In other words, we need to have a loop that runs up to a given number starting from 1 and multiplies the current temporary result by each number. It multiplies 1 x 2, then takes the result and multiplies it by 3, then takes this other result and multiplies it by 4 and so on. The logic is always the same, but the output will change based on the input.
To define a function, we use the def keyword and provide a name for the function, such as factorial. Then, we list between normal brackets the parameters, or inputs that functions want. We can use those inside the function (if we have multiple, simply separate them with comma).
def factorial(n):
  if n <= 0:
    return 0
  result = 1
  for i in range(n):
    result = result * (i + 1)
  return result

factorial(5)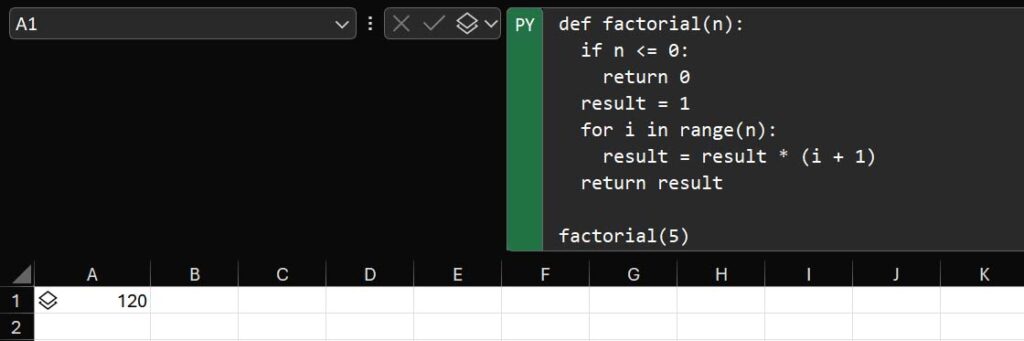
Note that we are using the return keyword. That simply means to give back a value outside of the function and abort its execution. If the number provided is 0 or less, we return immediately 0 and the function stops execution. Otherwise, we proceed with the multiplications and at the end of the function we return the result we computed.
We are multiply results by the current number in the range (i) plus 1, rather than just i, because the first number is 0 and the last number is 4, not 5.
After we define the function, we can call to execute it by providing the function name and providing values for its input parameters. Those can be static values, as in this case, or other variables not defined within the function. In fact, the function uses the input parameter n. That is scoped only within the function, if we have another “n” variable outside of the function it will have a different value. As a best practice, avoid using the same variable names outside and inside the function (but it is okay to use it in two different functions).
Classes
Classes are another important concept in any programming language, and they are at the basis of any modern programming language. Classes support the programming logic called “Object-Oriented Programming”, which has been the standard since at least a decade.
In traditional programming, also called procedural or functional, you will have all your code written in functions. Then, you will define data structures such as lists and dictionaries and use functions to modify them. You separate data from logic around that data, adding unnecessary complexity.
With classes, you can define an entity that has some parameters (data) and some methods (functions). In other words, the same entity holds both the data and the logic that modifies that data. To be more specific, we have two concepts: classes and objects.
A class is a definition of a collection of attributes (variable names) and methods (functions) that work together. It is just a definition, it does not do anything. Instead, an object is an instance of a class, a copy of the class with attributes set to some values. Let’s start to look at an example.
class MovingEntity:
  def __init__(self, x, y, speed):
    self.position_x = x
    self.position_y = y
    self.speed = speed

  def move(self, direction, multiplier):
    if direction == "x":
      self.position_x = self.position_x + (self.speed * multiplier)
    elif direction == "y":
      self.position_y = self.position_y + (self.speed * multiplier)

  def forward(self, direction):
    self.move(direction, 1)

  def backward(self, direction):
    self.move(direction, -1)

  def get_status(self):
    return "I am at [" + str(self.position_x) + ", " + str(self.position_y) + "] and can move with a speed of " + str(self.speed)

my_object = MovingEntity(0, 0, 10)
my_object.forward("x")
my_object.backward("y")

my_object.get_status()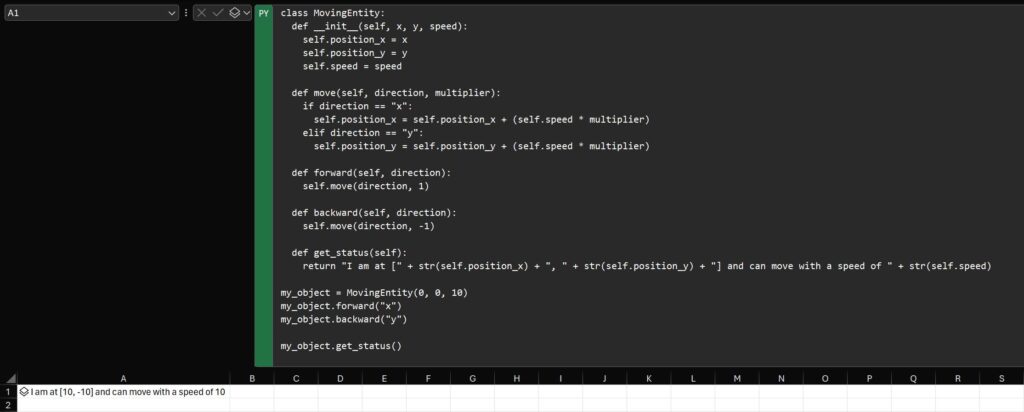
Here, we define a class named “MovingEntity” that represents something that can move in a space, defined as coordinate over x and y axis. Whenever we create an instance of this class, we want to set its position over the x and y axis, and we want to set the speed at which the entity can move. Then, we want to prepare some logic for the movement of the entity, and some logic to get the position.
First, we have an __init__ method inside the class. This requires three parameters: the initial x, y, and the speed. Note that we also have another parameter at the beginning, named self. That refers to the current instance of the object, and we use that to access all the attributes of the object itself during execution. So, we use this to set the position_x, position_y, and speed attribute of the object. This code will run whenever we create a new object and provide parameters for it.
Then, we have a move method that based on the direction (x or y) updates the coordinate. If we move forward, we provide a multiplier of 1 so that we add the speed. If we move backward, we use a multiplier of -1 to decrement the speed. After this, we have forward and backward methods that call the move method with respective multipliers. Finally, we have a get_status method that simply returns a string explaining the status.
Note how we use self to access the attributes and methods of the class. All of this is only logic however, we have not define what value we want in x, y, or speed. That will be done when we create the object.
The object we have in this example is my_object, it is a MovingEntity we init at coordinates 0 (both for x and y) and that has a speed of 10. When we run that line of code, the class is reserved some space in memory and the code in the __init__ method (called constructor) is called. Then, we can use this object to move it around and get its status.
Unlike normal function, we use <object name>.<method name>() to call a method on an object. We can do that even on self, because self is an object as well (the current object).
Classes are a large and complex topic, it may take some practice for you to fully grasp them, and an extremely long time to master them. Yet, for the purpose of Python in Excel, this is more than enough.
Try-Except
Another important topic we want to cover as part of the Python crash course is the Try-Except construct, a good way to handle errors in Python, and that works well also in Python in Excel.
Try-Except works like this: we attempt to run some piece of code in the Try block, and if that fails, we go inside the Except block instead of failing completely. In the Except block, we can access the error and do some debugging, for example logging the error or sending it somewhere.
result = ""

try:
  result = 1 / 0
except Exception as e:
  result = e
result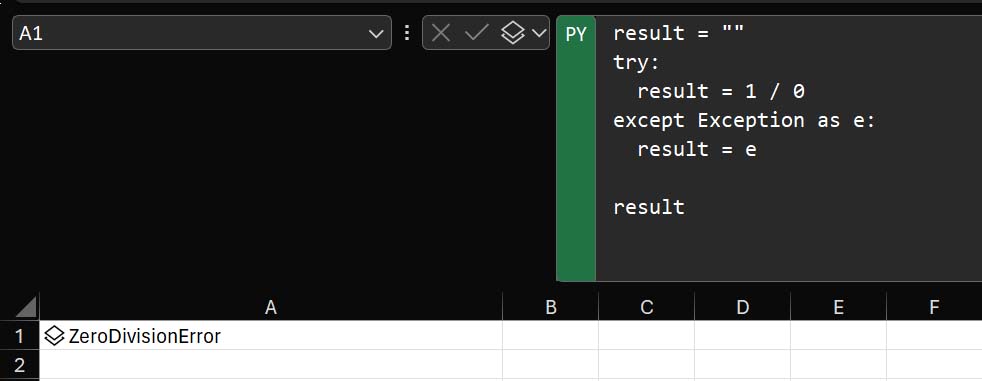
Note that here we are triggering a known error, attempting to divide by zero, so that we can force the code to go inside the Exception block. The except block wants to know which kind of exception we are getting, and a variable name we want to use to store the error. In this case, we intercept any error (Exception = any kind of error) and we store it in a variable we name e.
Potentially, you can have multiple except blocks, each intercepting different exceptions (such as ZeroDivisionError). In this way, you can handle different errors in different ways.
This is the last item in the Python Crash Course for Python in Excel. However, this course is by no means comprehensive of everything that exists in Python. We still have special Python concepts like decorators, iterators, async statements to cover, and more. But they are beyond the purpose of Python in Excel: the tools you learned here are enough for you to work in Excel. However, if you are curious to learn more about Python (strongly encouraged), you can continue with the Python ultimate course for beginners.
Advanced Python in Excel
Initialization and shared libraries
Python in Excel would not be as versatile as it is if you had to write all your Python code in every cell. In fact, the main benefit of things like functions and classes is that you can define them in advance and just call them/use them where you need them.
How can you make a Python function available to all cells in Python in Excel? How can you do the same for a class?
The answer to both questions is simple enough. Excel will process your Python code left to right and top to bottom in each sheet, much like you read on a piece of paper. It will start in the first sheet in your document (the leftmost one), and the progress throughout sheets, even if the first sheet is hidden. Any cell running Python will have available the code that ran in previous cells, including its data structures, classes, functions, and instantiated objects.
This means, if you want to create shared functions or libraries, put them in the cell A1 of the first sheet. Use that to write down all your common logic, then hide the sheet to keep things clean. If you define a function there, you will be able to call it in any other sheet.
This code is in cell A1 of first sheet:
def defined_in_first():
  return "Yay, I was defined in another sheet"
This code is in cell A1 of second sheet, and it works:
defined_in_first()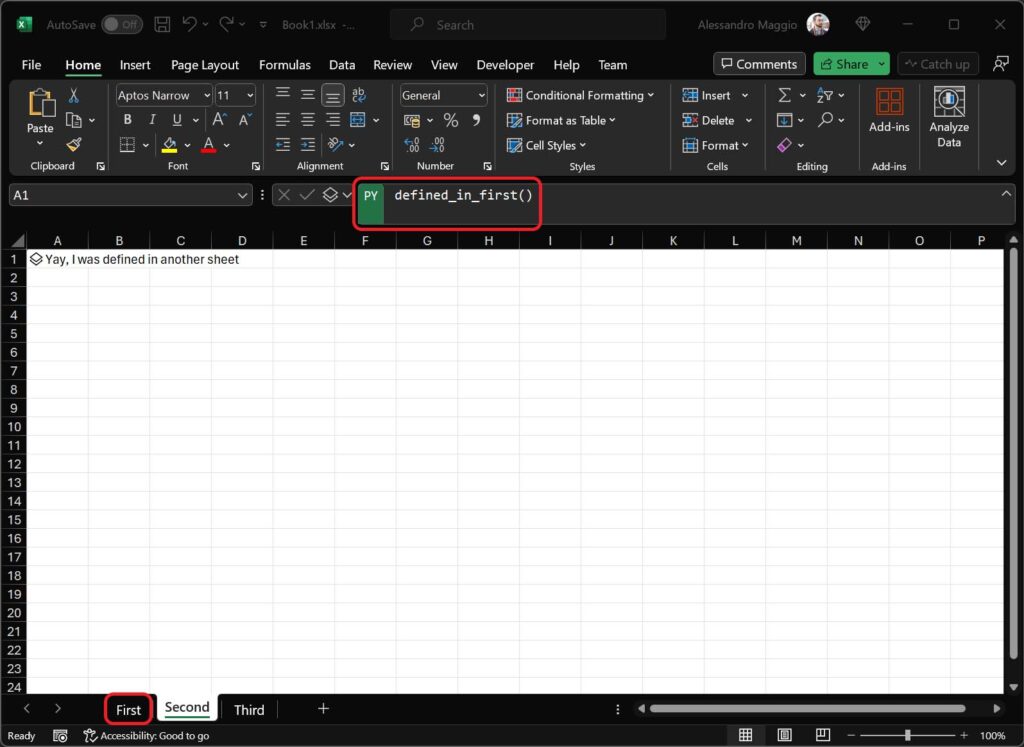
My recommendation is to have the first sheet in your file dedicated exclusively to shared libraries. To avoid confusion, you can define each class or function in a separate cell. In a sense, treat each cell as if it was a separate Python file you are importing into your project. This is how the dependencies in Python in Excel work.
Pandas dataframes in Excel
Another key tool you can use in Python in Excel are pandas dataframes. In case you don’t know, Pandas is a data analysis library available in traditional python. It allows you to explore, clean, and process your data, and it is especially designed to work with data in table structures. What a good match for Excel!
You can use Pandas objects, functions, and constructs straight away in Python in Excel, without importing anything. It comes pre-installed. Specifically, you will be working all the time with a special Pandas entity, called DataFrame.
In Pandas, a DataFrame is a collection of data in a table structure. When you use the xl() function, Python in Excel will in fact return a DataFrame by default (if you select a multi-cell range). The process is typically like this:
- Add your raw data in a table in Excel
- Use pandas inside Python in Excel (a
=PY()cell) to filter, sort, clean, or process your data - Show the resulting processed table in another range or sheet
Doing like this, you can have an Excel that works with nasty raw data that you can update frequently and that pandas will take care of cleaning and formatting for you.
Let’s start with a simple example, let’s use the filter() function to process a dataframe and show only specific columns, rather than all columns. Note how in this example the xl() function is returning a DataFrame indeed.
df = xl("products[#All]", headers=True)

df.filter(["sku", "price"])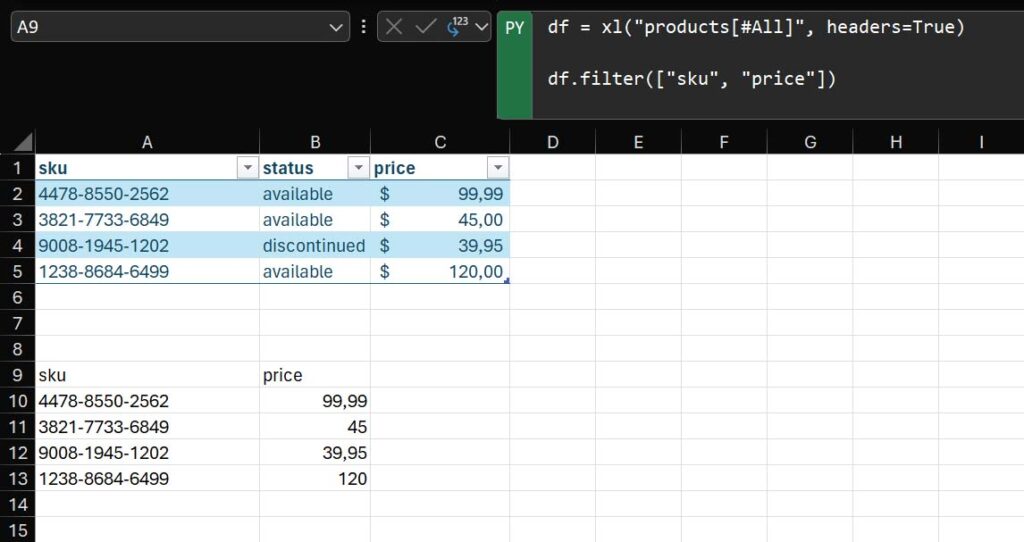
We can also filter out rows. For that, we can use a specific condition between square brackets next to the DataFrame name. This will return only the rows in the dataframe that match that condition. Note that this return is in form of a dataframe, which mean we can always apply a filter or another function to that.
df = xl("products[#All]", headers=True)

df = df.filter(["sku", "price"])

df[df["price"] > 40]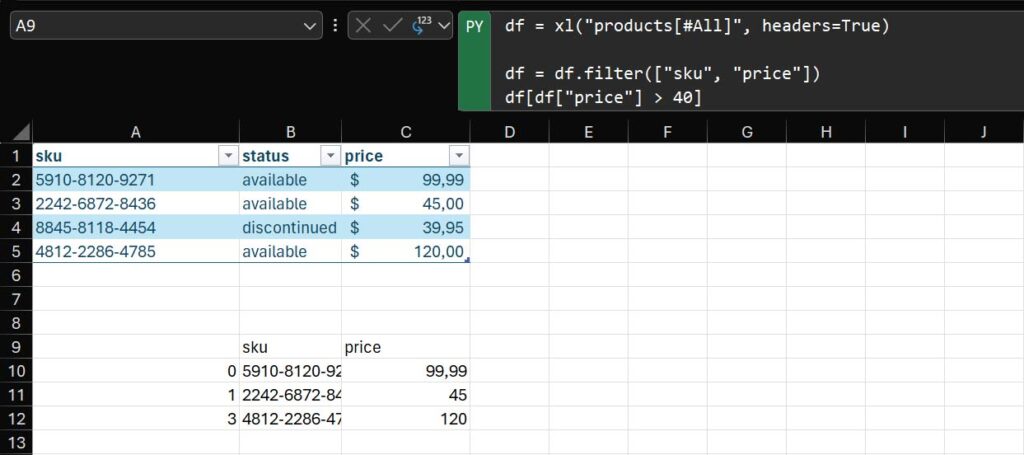
Note that if we do this, pandas will add one more column at the beginning to show the index of the record. With the filter applied, price higher than 40, we are skipping the third item that had a price of $39.95 and that was at position 2. In fact, you see the index shown are 0, 1, and 3. We can achieve the same result using the query() function. This allows us to specify a filter in a more textual way, as a string which pandas will parse.
df = xl("products[#All]", headers=True)

df = df.filter(["sku", "price"])
df.query("price > 40")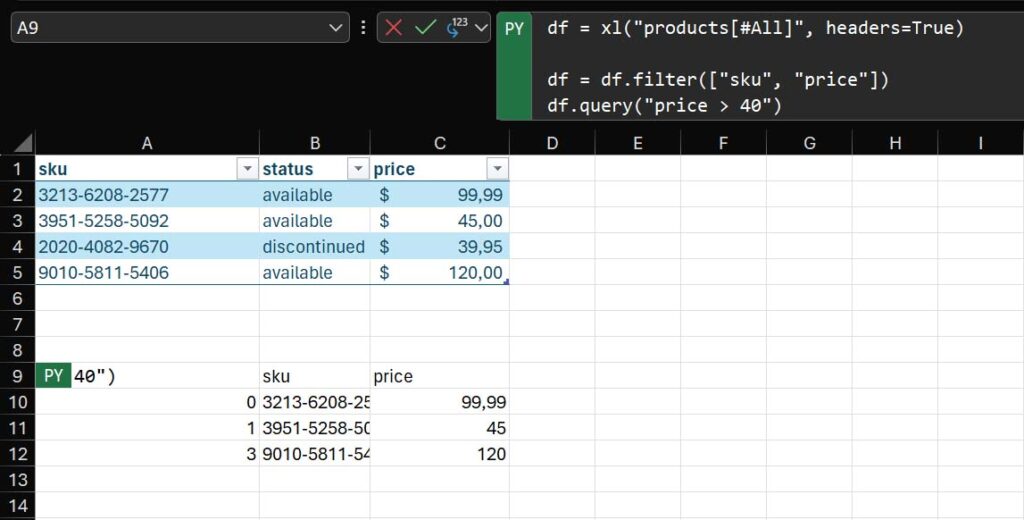
Other than filtering, we can use pandas to modify the table. We can use simple (or complex) operations to add more columns or to modify existing columns.
df = xl("products[#All]", headers=True)

df = df.filter(["sku", "price"])
df = df.query("price > 40")
df["tax"] = df["price"] * 0.10
df["full_price"] = df["price"] + df["tax"]

df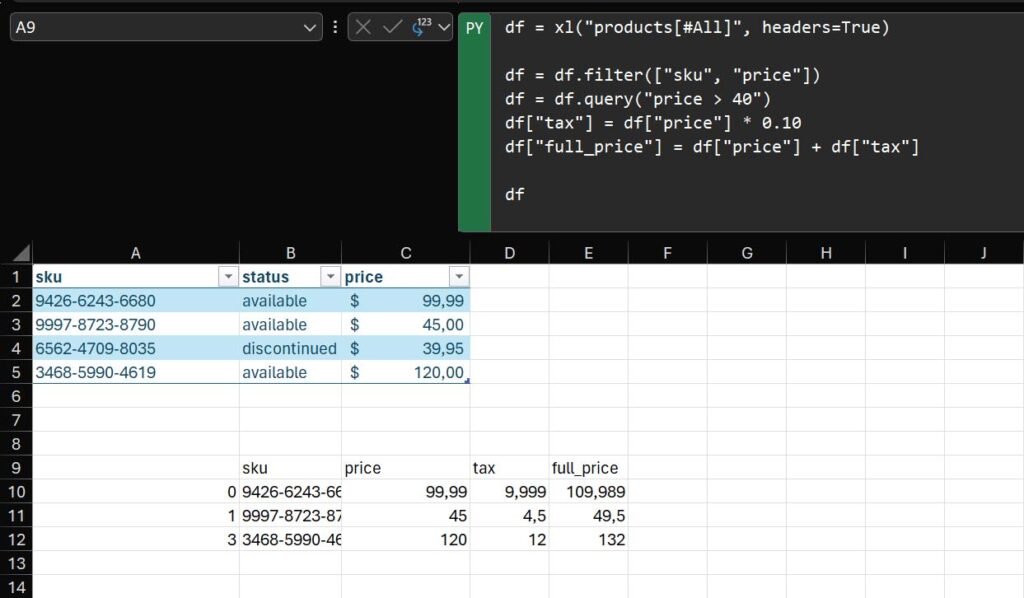
Pandas can do many more complex things, that are not specific to Python in Excel. For example, you can use it to create pivot, calculate mean of fields and columns, and more. If you are serious about going into Data Analysis, pandas is a tool you must learn. You will find how to progress on this in the additional resources section, at the end of this guide for Python in Excel.
Now, we can continue to explore another important tool of advanced Python in Excel: matplotlib, the python library to create plots and charts.
Using matplotlib in Excel
Matplotlib is the other key tool in advanced Python in Excel you need to know. It works well with pandas, but it has a different function. While pandas serves to process, clean and filter data, but leaves them in a table-like structure, matplotlib takes data as is and creates visualizations based on the data.
That is, you don’t use matplotlib to modify or filter your data. You use it to put it into charts or other graphic displays. If you have never tried matplotlib before, you may think “why do we need that with Python in Excel?”. This question is reasonable, because Excel has already some native charting capabilities. But matplotlib plotting capabilities are much higher than normal Excel.
We can do many things that Excel charts can’t do. We can combine multiple charts together, add vertical lines easily without strange workarounds, use logarithmic scales, sync two charts, have granular control on the graphic (colors, shapes, sizes etc.) and do everything programmatically. It also has many more chart options. And, even better, Python in Excel comes with matplotlib pre-installed. This means you can use it straight away!
Let’s look at this example that plots the S&P price from January to May 2019, using Japanese candlesticks. Japanese candlesticks are a type of chart used in trading and finance that for each date shows the price of a stock or financial instruments in four different flavors. The open price is the price the stock started the day at, while the close price is the price at which the stock finished the day at. They limit a column, which is red if the close price is below the open price (the stock went down), or green if the close price is higher than the open price (the stock went up).
The other two prices that are shown are the absolute maximum and minimum reached during the day, which are represented by small lines stemming out of the main bar. Those are not visible all the times on either end in case close or open correspond to the maximum or minimum.
Now, let’s look at the code and then we can have an explanation.
df = xl("spx[#All]", headers=True)
df.set_index("date")

plt.figure()

up = df[df.close >= df.open]
down = df[df.close < df.open]

# Plot days when the stock is going up
plt.bar(up.date, up.close - up.open, 0.8, bottom=up.open, color="green")
plt.bar(up.date, up.high - up.close, .03, bottom=up.close, color="green")
plt.bar(up.date, up.low - up.open, .03, bottom=up.open, color="green")

# Plot days when the stock is going down
plt.bar(down.date, down.close - down.open, 0.8, bottom=down.open, color="red")
plt.bar(down.date, down.high - down.close, .03, bottom=down.close, color="red")
plt.bar(down.date, down.low - down.open, .03, bottom=down.open, color="red")

plt.xticks(rotation=45, ha="right")

plt.show()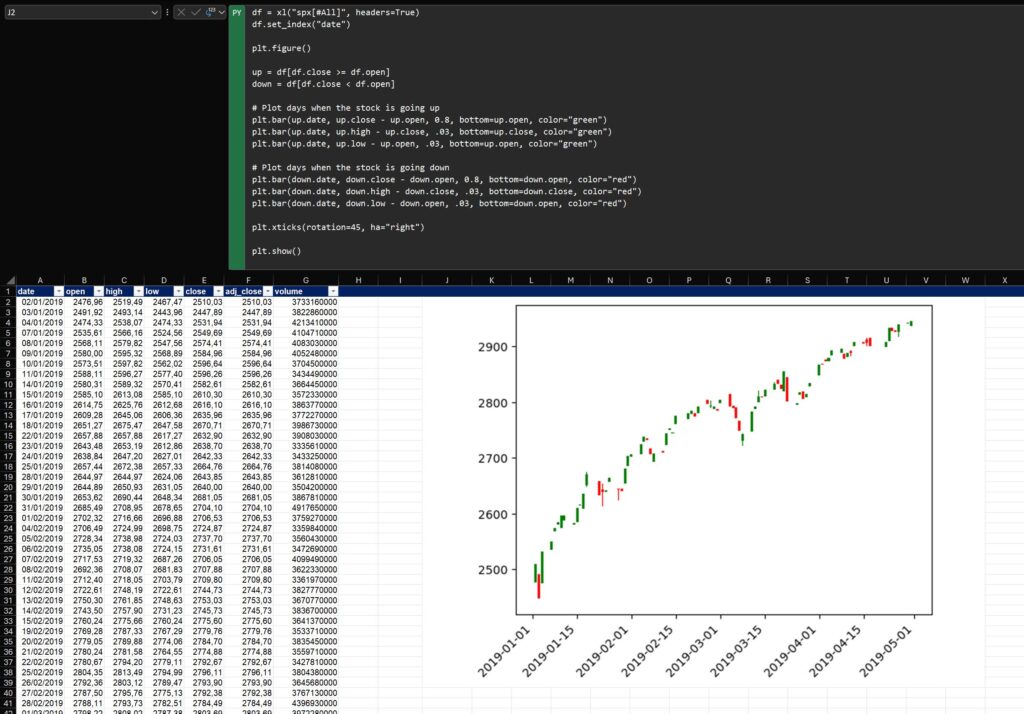
First, we load the dataset from the adjacent table into a “df” object, and we index it on the date column. Setting the index to the date means that the date is going to be the x axis if we plot the chart, and it is useful in case we want to compare and plot together multiple charts: they will be reconciled where the index (date) has the same value.
df = xl("spx[#All]", headers=True)
df.set_index("date")
We then tell matplotlib, the plt object, that we want to create a new figure, or chart. Matplotlib is listening from this point onward and will put any new chart that we draw into this new figure, until we create a new one (we don’t, in this example).
plt.figure()Now we want to create two separate series, one considering only datapoints when the stock went up, and another considering only datapoints where the stock went down. In this way, we can plot each serie using different colors (green and red). We thus filter the original dataset and store the output into two new datasets.
up = df[df.close >= df.open]
down = df[df.close < df.open]
Now, it is finally time to plot. A Japanese candlestick is a single unit and point in time showing four values: open, close, max, and min. However, we do not have such object natively in matplotlib, Python in Excel, or Excel in general. But we can do a trick: we can plot three objects one on top of another. We will plot the main body of the candlestick first, then the line stemming upward, and then the line stemming downward.
The first statement plots the main body, and we can see that because we provide a width of 0.8. This 0.8-wide column starts at the open price (bottom=up.open) and is tall only the difference between close and open, so the upper limit is the close price. To go in order, we provide the x axis first (the date, the size of the column, the width of the column, and then we tell it where it should start from the bottom, and the color that we want.
We repeat the same process for the two thin lines (0.03 of width), plotting between high and close, and between low and open. We know that maximum is going to be always higher or equal to close, and that low is going to be always lower or equal to close. We also know that close is going to be higher or equal to open, and this is because this dataset is only providing us with days when the stock went up.
# Plot days when the stock is going up
plt.bar(up.date, up.close - up.open, 0.8, bottom=up.open, color="green")
plt.bar(up.date, up.high - up.close, .03, bottom=up.close, color="green")
plt.bar(up.date, up.low - up.open, .03, bottom=up.open, color="green")
Since we are indexing on date, we do not need to worry if we are skipping days (as not every day the stock goes up, some days will be empty for this dataset, in favor of the down dataset). Whenever we skip a day, it will be left blank.
We repeat the same process for the down series, but now plotting it into red.
# Plot days when the stock is going down
plt.bar(down.date, down.close - down.open, 0.8, bottom=down.open, color="red")
plt.bar(down.date, down.high - down.close, .03, bottom=down.close, color="red")
plt.bar(down.date, down.low - down.open, .03, bottom=down.open, color="red")
I tried to plot the chart at this point, but saw the values on the x axis got crammed up on top of each other. So, I decided to rotate the labels of the axis 45 degree, and have the tick to their right.
plt.xticks(rotation=45, ha="right")We are now finally ready to plot the chart. Now that I have merged the cells from J2 to W41 to have more space for this chart.
plt.show()Matplotlib makes Python in Excel so powerful, and it offers many different alternatives. You can plot so many different types of charts and group them together. If you are serious about data visualization, check the additional resources at the end of the guide to learn how to plot more charts and do advanced stuff with matplotlib.
Conclusion
Privacy considerations for Python in Excel
If you are working in a company, you should be mindful about privacy considerations for Python in Excel. This is because the data you process with Python in Excel are not just on your computer, they are sent to Microsoft servers somewhere in the world.
So, you need to see if this is viable for your company’s privacy policy and data protection requirements. In Europe, for example, you have the General Data Protection Regulation (GDPR) that basically says data about EU citizens should remain within EU boundaries, or treated with special care anyway.
In general, this is nothing to worry about if you are not dealing with personal information or with public data. It is also nothing to worry about if your company is actively using OneDrive, since the processing of Python in Excel happens in the same servers used for OneDrive (note that this is a simplification, but it is true from the privacy point of view).
This is not legal advice, if you are concerned about privacy and Python in Excel it is better to drop a message to your legal department.
What Python in Excel can’t do
Python in Excel is a powerful tool, but is has a key limitation that may make it not suitable for every job. Python in Excel can’t alter the structure of the Excel file. In the end, it is just a supercharged version of an Excel formula. This means, as of 2023, it cannot completely replace VBA or other custom solutions.
For that, you can take a look at the alternatives to Python in Excel below.
Alternatives to Python in Excel
Python in Excel is not the only way to go to achieve the outcomes listed here. You mainly have two options, VBA and Python outside Excel.
VBA, or Visual Basic for Applications is the original programming language that was embedded into Excel. With that, you can do literally all the data processing and cleaning you can do with Python for your Excel sheet. The only problem with that is that VBA is much more complex to write and does not have most of the interesting modern features that Python has. However, VBA can do things that Python in Excel can’t. It can do macros, it can alter the content of the Excel file permanently. With Python, instead, you can only process data dynamically but not alter the shape or form of the Excel file itself.
An even more powerful alternative is Python outside Excel. This has some disadvantages, but some big advantages over Python in Excel. This solution means that you have your Excel file and you use it for data input and output or visualization. Then, you have an external Python script that reads the file, alter it if required, and produces visualization or charts (using matplotlib, for example). This is much more powerful because features of Python are not limited, unlike in Python in Excel. You also don’t have any privacy concern, as everything runs in your computer. The problem is you need to go back and forth between Excel and an external Python script, and if you produce data visualization then you need to open images separately.
All in all, Python in Excel is not the only way to go, but for most use cases it is probably the best way. Keep this in mind when structuring your next data analysis.
Additional resources
Let me leave you with some key resources you can use to foster your knowledge of Python in Excel.
- Ultimate Python course for beginners
- Guide on how to use Pandas
- Guide on how to use Matplotlib
- More information on Data Analysis
- Microsoft official website
Please, if you find additional resources that you think are useful for this guide, connect with me (read below) so that I can add them here. This should be the one-stop-shop for everyone trying to do more with Python in Excel.
Connect and Get Help
Let’s avoid the usual wrap up “In this guide we saw how to use Python in Excel …” and do something more personal. If you liked this guide (or not), please reach out to me and let me know. Even better, if you think there is something more we can add here, this is a living document and I will be happy to add additional content to be sure anyone can become a master of Python in Excel.
So, reach out to me on LinkedIn. Add me to your network, but please specify in the notes that you read the Python in Excel guide and you would like to talk about it, make suggestions, or whatever. If you just connect without a note, I will not accept the request.